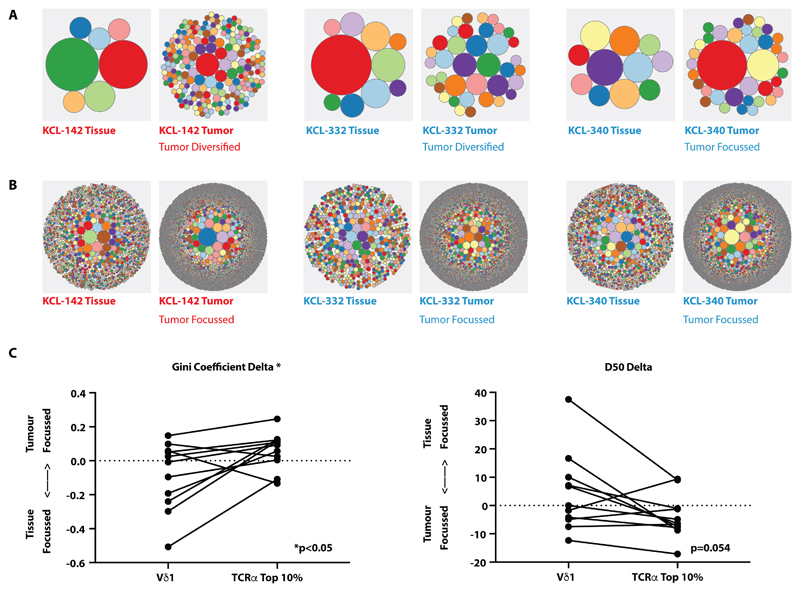
Fig. 5. Lack of tumor Vδ1+ TCR focussing vis-à-vis focussing of TCRα.
(A) Examples of circular tree plots of the Vδ1+ repertoire in paired non-malignant tissue (“Tissue”) and tumor tissue (“Tumor”), where each circle represents a unique TCR clonotype and the size of the circle is proportional to the representation of the specified clone. Plots were generated from total Vδ1+ TCRs. (B) Examples of circular tree plots of the TCRα repertoire in paired non-malignant tissue (“Tissue”) and tumor tissue (“Tumor”). Plots were generated from total TCRα+ TCRs. (C) Vδ1+ and TCRα+ sequences in non-malignant and tumor tissue were down-sampled (within each patient) to equivalent numbers to calculate diversity metrics. The degree of repertoire focussing was assessed by the delta of the Gini coefficient and the delta D50 of sequences of Vδ1 chains and the top 10% in abundance of TCRα sequences in tumor versus paired non-malignant repertoires. To test if the degree of repertoire focusing was different between Vδ1+ and TCRα+ compartments in individual patients, the Wilcoxon matched pairs signed rank test was used to compare ΔGini and ΔD50. All sequences were analyzed based on amino acid sequence. n=11.

