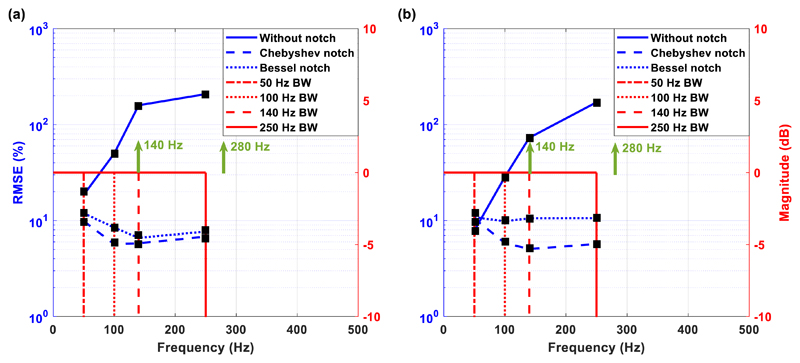
Figure 13.
Normalised root mean square errors (RMSE) between the signals recorded in and without the presence of unipolar (a) and bipolar (b) stimulation. The green vectors show the main stimulation frequency component (=140 Hz) and the stimulation harmonic that is closer to the available passband (=280 Hz). The red lines (correspond to the right y-axis) show the available bandwidth (BW) for each recording trial and the blue lines (correspond to the left y-axis) depict the calculated RMSE values.

