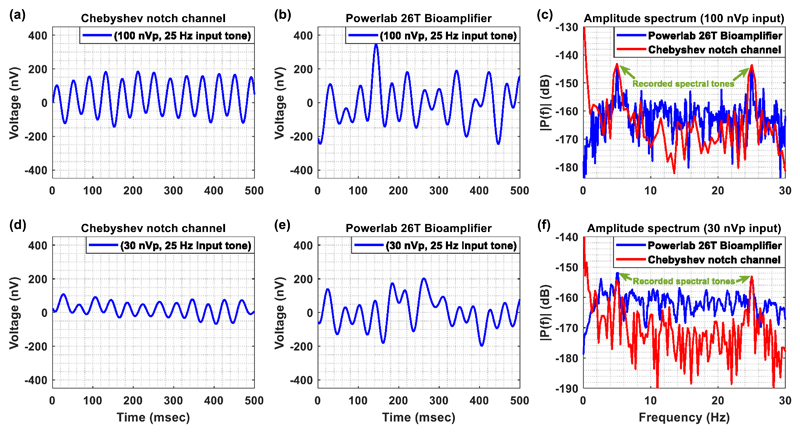
Figure 7.
(a) Output voltage (after removing the gain of 80 dB) recorded from the Chebyshev notch channel when a sinusoidal single tone (25 Hz, amplitude 100 nV peak) was injected to the input of the channel. (b) Output voltage recorded from the Powerlab 26T bioamplifier when a sinusoidal single tone (25 Hz, amplitude 100 nV peak) was injected to the input of the system. (c) Amplitude spectrum calculated when two sinusoidal tones, one low-frequency (=5 Hz) and one higher-frequency (=25 Hz) are sequentially injected to the inputs of the two AFEs. The amplitude spectrums of both systems present two spectral peaks at 5 and 25 Hz, which are characterized by the same amplitude. (d) Output voltage (after removing the gain of 80 dB) recorded from the Chebyshev notch channel when a sinusoidal single tone (25 Hz, amplitude 30 nV peak) was injected to the input of the channel. (e) Output voltage recorded from the Powerlab 26T bioamplifier when a sinusoidal single tone (25 Hz, amplitude 30 nV peak) was injected to the input of the system. (f) Amplitude spectrum calculated when two sinusoidal tones, one low-frequency (=5 Hz) and one higher-frequency (=25 Hz), are sequentially injected to the inputs of the two AFEs. The amplitude spectrums of both systems present two spectral peaks at 5 and 25 Hz, which are characterized by the same amplitude.

