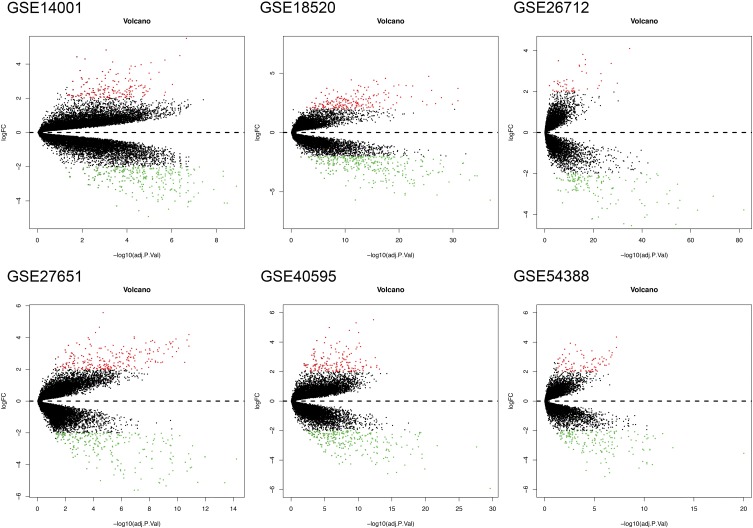
Figure 2.
DEGs obtained from each GEO dataset (GSE14001, GSE18520, GSE26712, GSE27651, GSE40595, and GSE54388). The red points represent upregulated genes screened with |log2FC| ≥ 2 and adjusted P < 0.05. The green points represent downregulated genes screened with |log2FC| ≥ 2 and adjusted P < 0.05. The black points represent genes with no significant difference in expression.
Abbreviations: DEGs, differentially expressed genes; GEO, Gene Expression Omnibus; FC, fold change.

