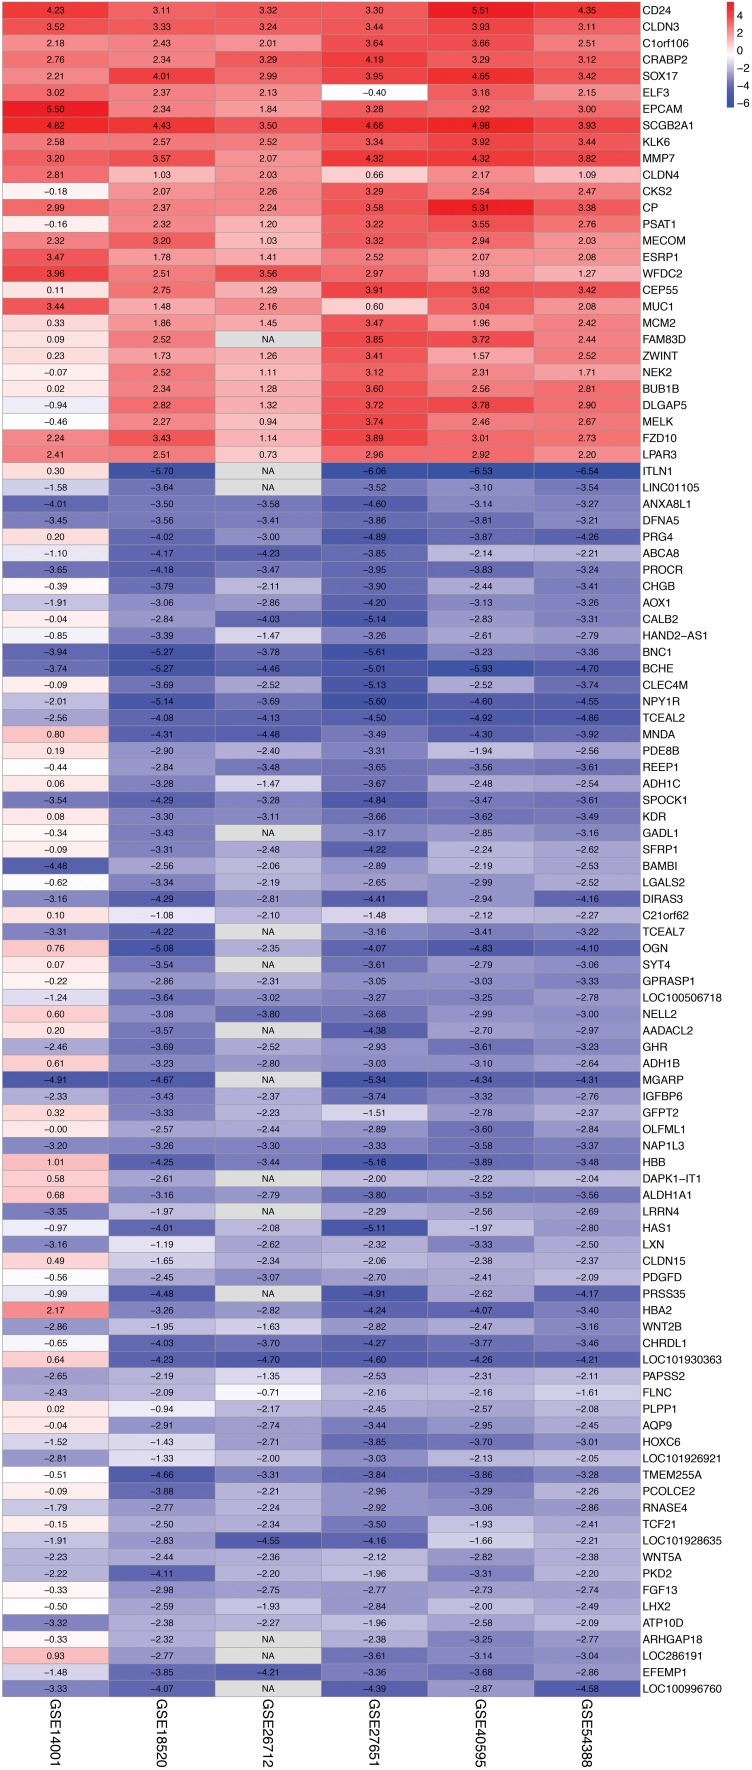
Figure 3.
Heat map of the 103 DEGs identified in the integrated microarray analysis. Each column represents one dataset, and each row represents one gene. The number in each rectangle is the log2FC value. The color gradient from blue to red represents the progression from down- to upregulation.
Abbreviations: DEGs, differentially expressed genes; FC, fold change.

