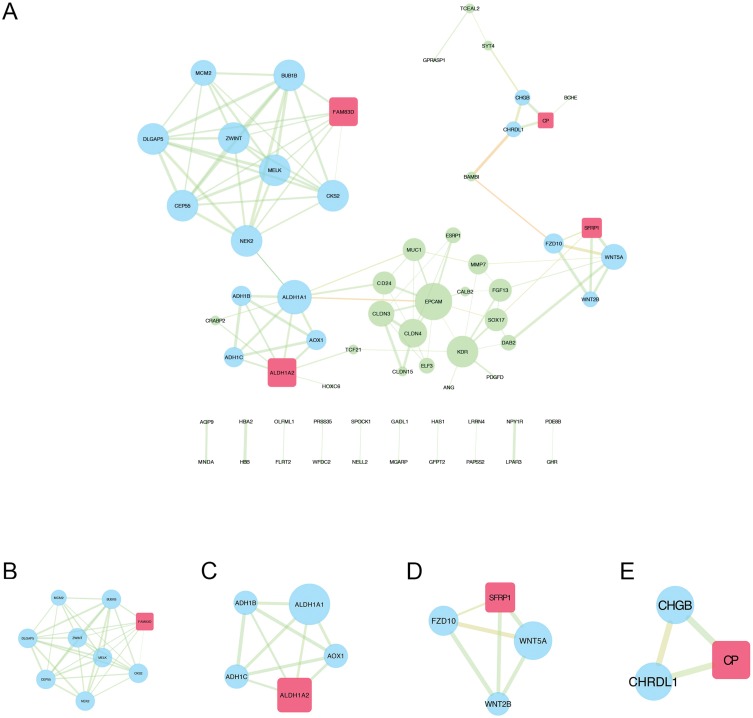
Figure 5.
PPI network construction and module analysis of DEGs associated with HGSOC. (A) PPI network of the integrated DEGs visualized by Cytoscape software. The node size represents the node degree (a larger node indicates a higher degree). The width of the edge indicates the combined score (a wider edge indicates a higher combined score). The color of the edge represents the EdgeBetweenness (a more orange edge indicates a higher EdgeBetweenness). (B-E) MCODE module screening for the DEGs, including module 1 (MCODE score = 7, nodes = 9, edges = 69), module 2 (MCODE score = 4, nodes = 5, edges = 28), module 3 (MCODE score = 3, nodes = 4, edges = 17), and module 4 (MCODE score = 2, nodes = 3, edges = 9). The red rectangle indicates the seed gene, and the blue circles indicate the clustered genes.
Abbreviations: PPI, protein–protein interaction; DEGs, differentially expressed genes; HGSOC, high-grade serous ovarian cancer; MCODE, Molecular Complex Detection.

