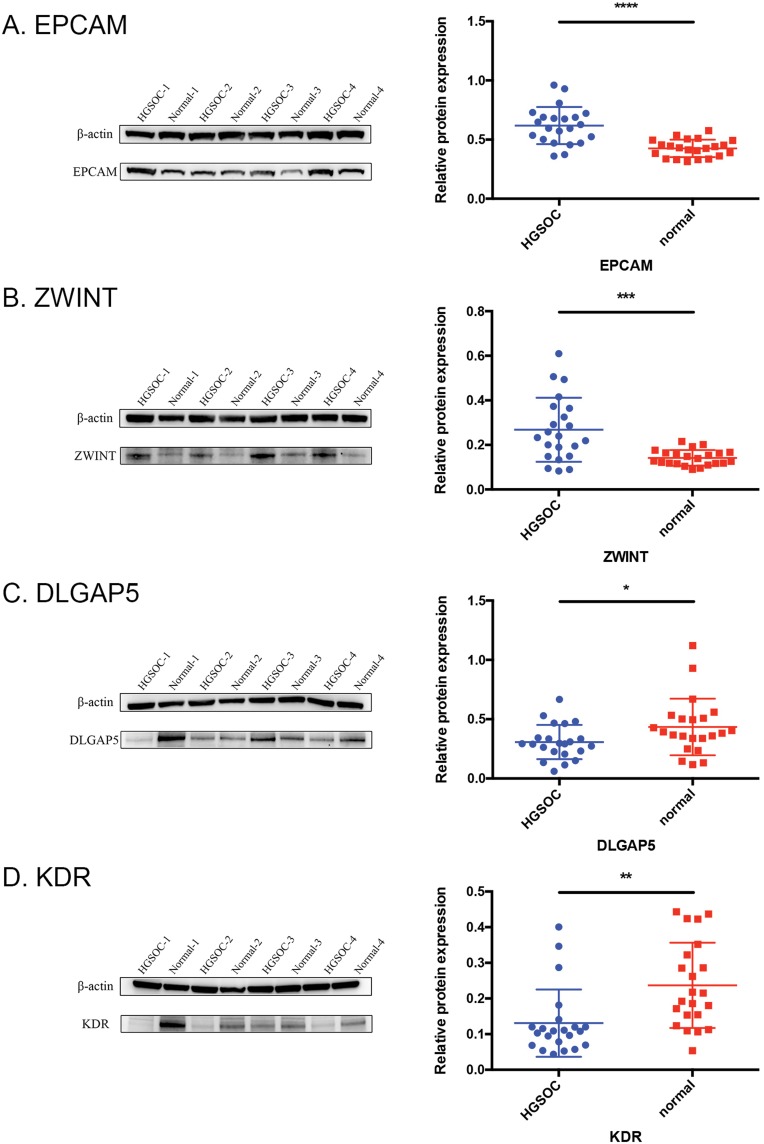
Figure 10.
The protein expression levels of EPCAM (A), ZWINT (B), DLGAP5 (C) and KDR (D) in 22 HGSOC and 22 normal ovarian samples were analyzed by Western blotting. Signal intensities were quantified by ImageJ and normalized to an internal control (β-actin). *P < 0.05, **P < 0.01, ***P < 0.001 and ****P < 0.0001.
Abbreviation: HGSOC, high-grade serous ovarian cancer.

