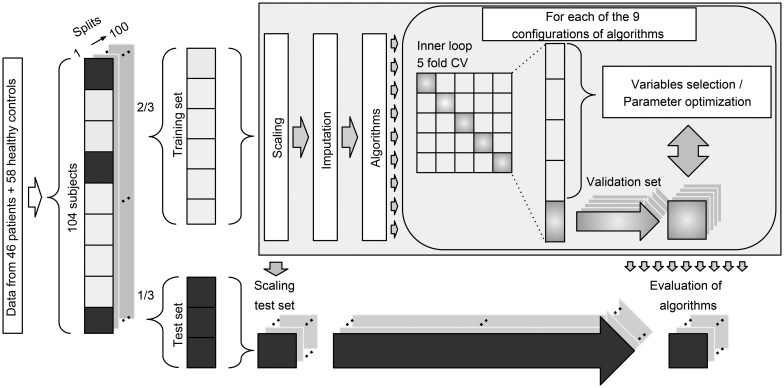
Fig. 1.
Diagram of the multivariate analysis pipeline. Forty-six patients and 58 healthy controls were included in the baseline analyses. ‘Data’ refer to input variables from cognition, electrophysiology, structural magnetic resonance imaging, and diffusion tensor imaging. For each of the 100 splits, 2/3 of subjects were used for training and 1/3 of subjects were used for testing. Subjects with missing data were not used in test sets. Training data were scaled (zero mean, unit variance), and the test sets were scaled using these parameters. Missing data were imputed using K-nearest neighbor imputation with K = 3 (Bak and Hansen, 2016), and only subjects with complete data were included in the test sets. Finally, nine different configurations of machine learning algorithms were applied to predict diagnosis. CV = cross-validation. See text for details.

