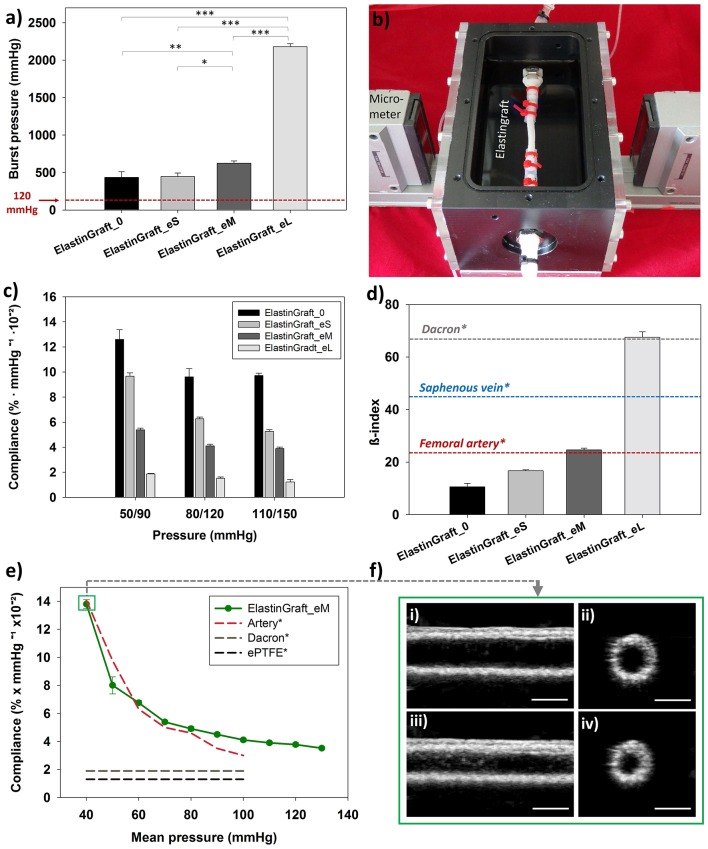
Figure 3.
Mechanical characterization of the ElastinGrafts. (a) Burst strength. (b) Vascular graft chamber used for assessing the compliance. (c) Compliances of the different ElastinGrafts at low (50–90 mmHg), normal (80–120 mmHg), and high pressure (110–150 mmHg). (d) Comparison of stiffness (β-index) between the ElastinGrafts, native blood vessels [value of the human femoral artery taken from Emoto et al. (1998) and value of the human saphenous vein taken from Zhang et al. (2017)] and Dacron [value taken from Tai et al. (2000)]. Values taken from literature are marked with an asterisk (*). (e) Compliance-mean pressure curve for the ElastinGraft_eM, artery, Dacron, and ePTFE. The values from the human external iliac artery, Dacron and ePTFE were adapted from Tai et al. (2000), Sarkar et al. (2006). (f) Ultrasound images of the ElastinGraft_eM in the simulated systolic low pressure of 60 mmHg (i,ii) and diastolic low pressure of 20 mmHg (iii,iv). The complete videos for the low (20/60 and 50/90 mmHg), normal (80/120 mmHg), and higher pressure ranges (110/150 mmHg) are available as supporting information (Supplementary Video S1).

