
Fig. 3.
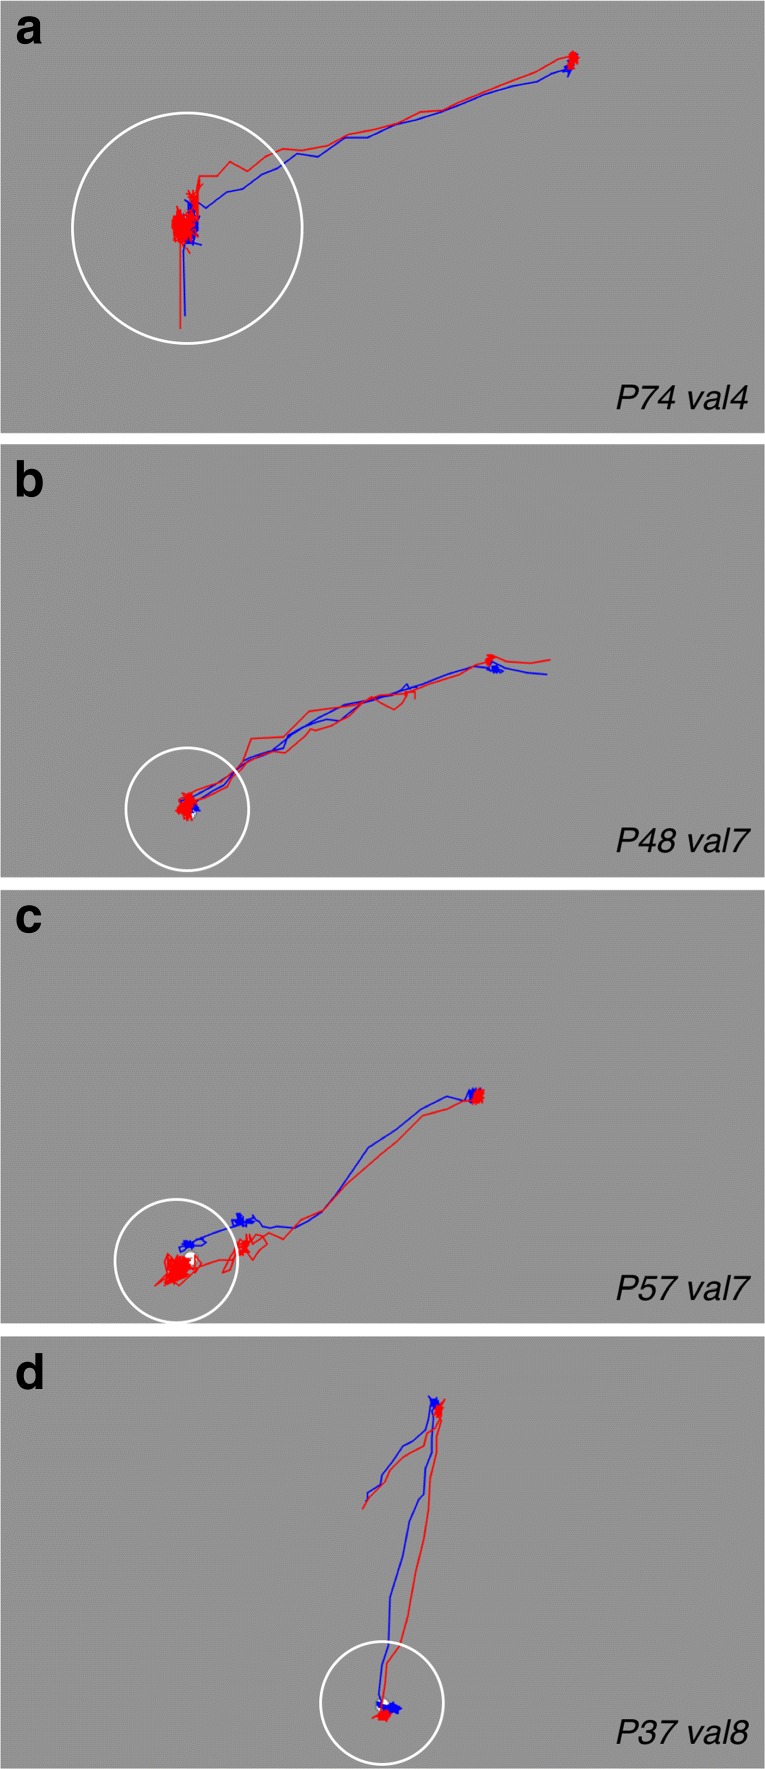
Examples of fixations used for computation of the systematic and variable errors (this figure is at the same scale as Fig. 2). Blue denotes signals of the left eye and red denotes signals for the right eye. The centers of the white circles contain the fixations that were used for calculation of the systematic and the variable errors. The calibration was self-paced, some participants only made saccades from one fixation point to the next one in the next display (panel a), other participants did not necessarily make saccades from one calibration point to another, they may have fixated anywhere on the screen before they fixated the calibration target (as in b, c, and d). Panels a and b show examples in which left and right eye signals overlap. Panels c and d contain examples that show larger systematic errors for the left eye (c) and right eye (d). Variable error is larger in panels a and c compared to panels b and d