Fig. 1.
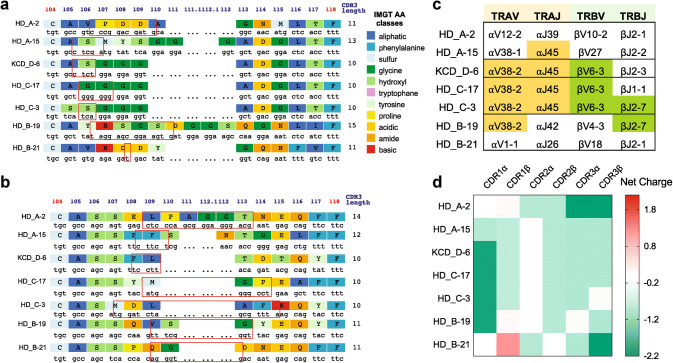
Characteristics of 5T4p17 -specific CDR3 regions of TRA and TRB. IMGT junction analysis is shown for aTRA-CDR3 regions and bTRB-CDR3 regions. Red boxes indicate N nucleotides and/or D regions (TRB) between V gene and J gene encoded sequence. c V- and J-gene usage for TRA and TRB are shown. Color shading identifies common gene use between TCRs. d The net charge for CDR1, 2, and 3 amino acid sequences from 5T417–25-specific TCRs are shown

