
Figure 3.
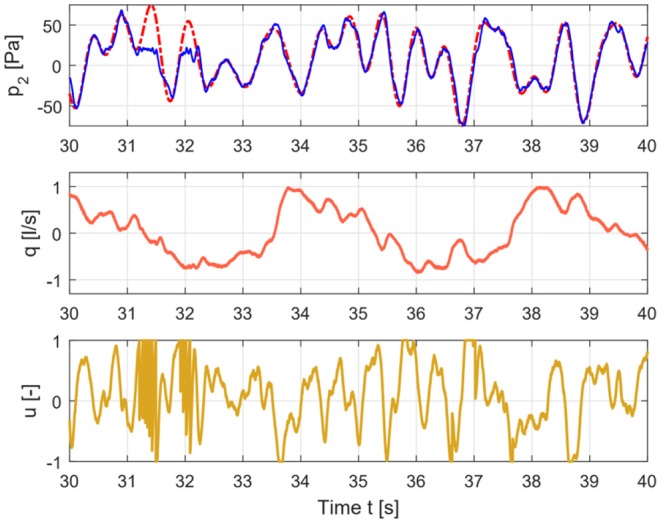
Time signals for healthy case depicting the input signal (lower graph), flow signal (middle graph), and pressure signal (upper graph).
Official websites use .gov
A
.gov website belongs to an official
government organization in the United States.
Secure .gov websites use HTTPS
A lock (
) or https:// means you've safely
connected to the .gov website. Share sensitive
information only on official, secure websites.
Time signals for healthy case depicting the input signal (lower graph), flow signal (middle graph), and pressure signal (upper graph).