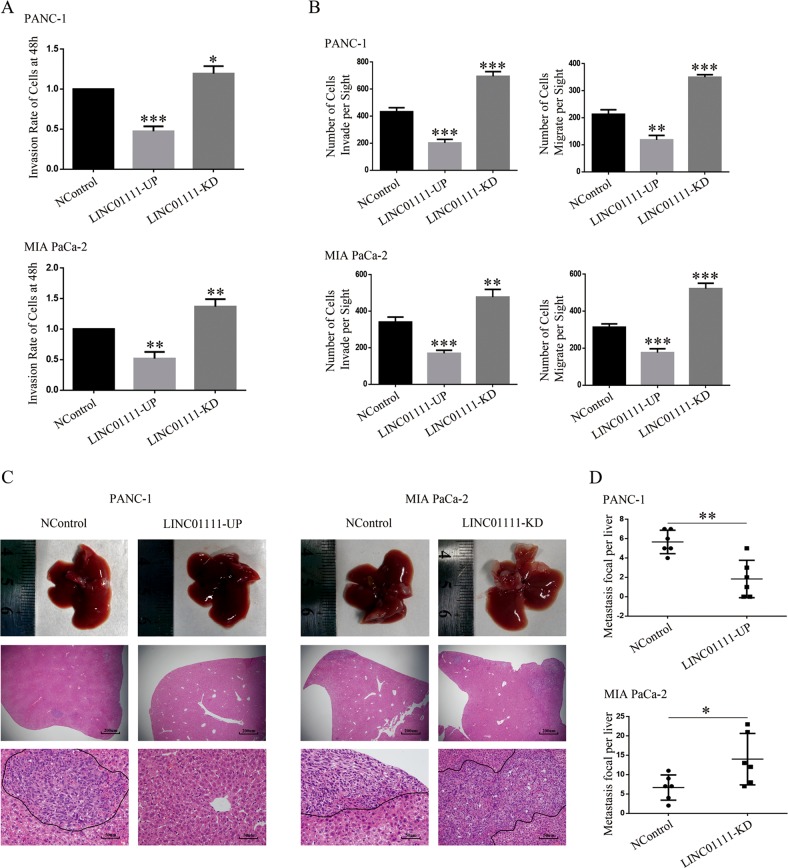
Fig. 3. LINC01111 suppresses the PC cell invasion and migration in vitro and in vivo.
a The bar graph showing the wound healing percentages of the indicated cell lines. All experiments were performed in triplicate, and data are presented as mean ± SD. *p < 0.05, **p < 0.01, ***p < 0.001. b The bar graph generated from the Transwell assay showing the invasion and migration of the indicated cell lines. All experiments were performed in triplicate, and data are presented as mean ± SD. **p < 0.01, ***p < 0.001. c Representative images of the liver metastasis models at 4th week. d The average numbers of visible metastatic nodules in the livers. Data are presented as mean ± SD. *p < 0.05, **p < 0.01.

