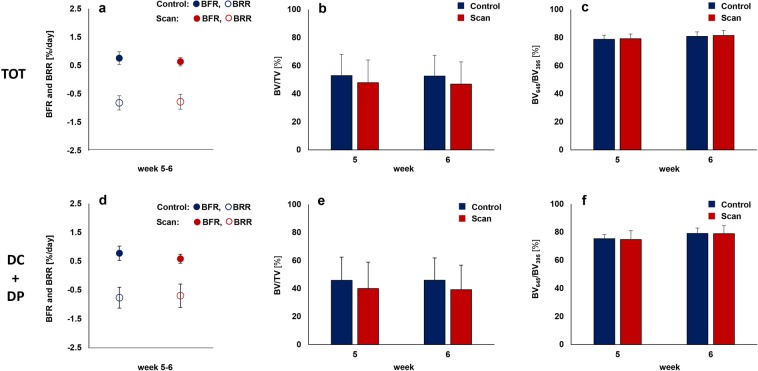
Figure 4.
Micro-CT based evaluation of bone parameters in the scan (red) and control group (blue) using different VOIS: total VOI (TOT: DC + DP + FC + FP) - defect and adjacent bone fragments (top), defect VOI (DC + DP) – defect center and periphery (bottom). (a,d) Formed (solid) and resorbed (empty) bone volume (BV) in the femur defect (TV) given in percent per day. (b,e) Bone volume (BV) normalized to TV (DC + FC for TOT and DC for DC + DP). (c,f) Degree of bone mineralization given as ratio of bone volume with a density ≥645 mg HA/cm3 to the total osseous volume in the defect (threshold ≥395 mg HA/cm3). Control group: n = 8, scan group: n = 10. * indicates p < 0.05 determined by two-tailed Student’s t-test (a–e,f week 6)/Mann-Whitney U-test (f: week 5).

