Fig. 6.
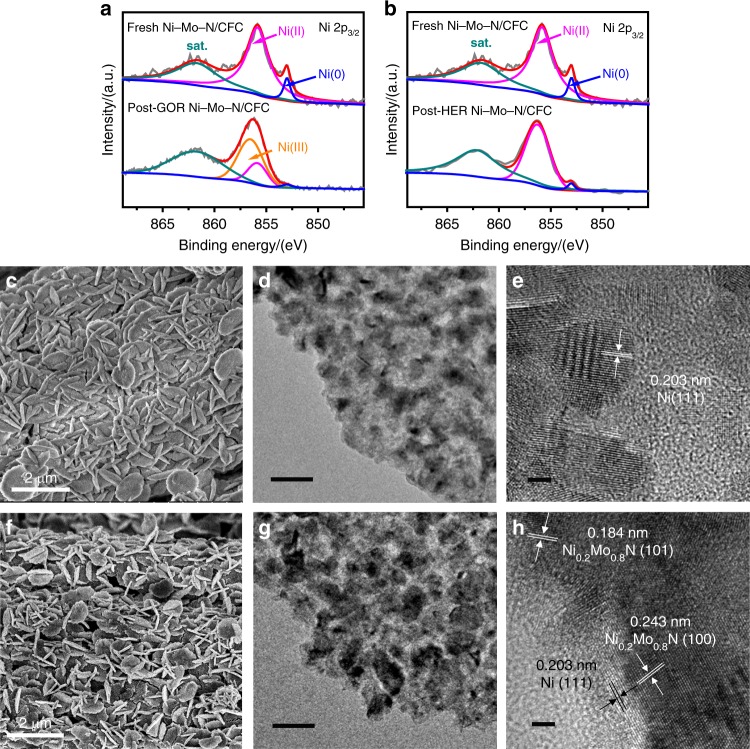
Morphology and composition characterizations of Ni–Mo–N/CFC after glycerol oxidation and HER. a High-resolution Ni 2p3/2 XPS spectra of Ni–Mo–N/CFC before and after glycerol oxidation at the anode. b High-resolution Ni 2p3/2 XPS spectra of Ni–Mo–N/CFC before and after HER at the cathode. c SEM, d TEM, and e HRTEM images of the anodic post-GOR Ni–Mo–N/CFC. f SEM, g TEM, and h HRTEM images of cathodic post-HER Ni–Mo–N/CFC. Scale bars, c 2 µm; d 50 nm; e 2 nm; f 2 µm; g 50 nm, h 2 nm.

