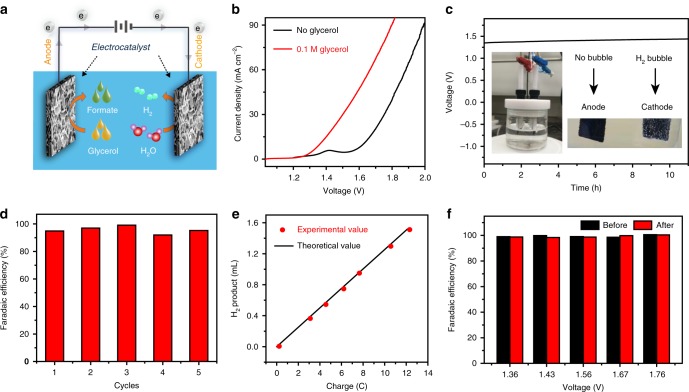
Fig. 7.
Electrochemical performances of Ni–Mo–N/CFC || Ni–Mo–N/CFC. a Schematic illustration for concurrent electrolytic hydrogen and formate productions from glycerol solution. b LSV curves for the Ni–Mo–N/CFC || Ni–Mo–N/CFC cell in 1.0 M KOH solution with and without 0.1 M glycerol addition. Scan rate, 2 mV s−1. c Stability test of the Ni–Mo–N/CFC couple in the cell at a constant current density of 10 mA cm−2 in 1.0 M KOH containing 0.1 M glycerol. d FEs of the Ni–Mo–N/CFC couple for formate production for five successive electrolysis cycles. e Comparison between theoretical calculation and experimental measurement of H2 evolution, indicating an up to 100% FE for H2 production on Ni–Mo–N/CFC catalysts. f FEs of the Ni–Mo–N/CFC couple for H2 at different potentials from the beginning to the end of 12 h glycerol electrolysis.

