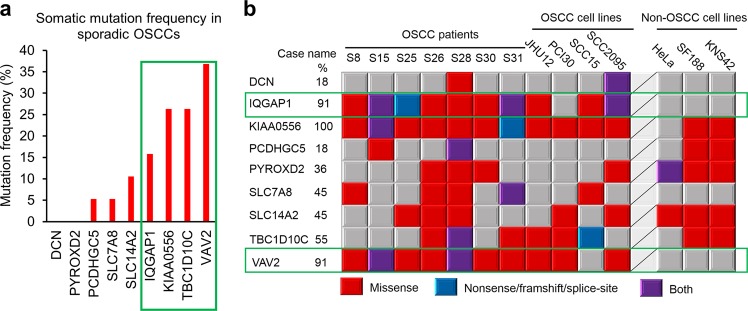
Fig. 2. Mutation frequencies of the familial OSCC predisposition genes in sporadic OSCC cases and cell lines.
a Bar graph of the somatic mutation frequencies (percentage of cases with detrimental mutations) of the nine genes in 19 normal-tumor paired cases. b Mutation landscape of the nine genes in seven tumor tissues without paired normal tissue controls, four oral cancer cell lines and three non-oral cancer cell lines. Gene symbols and percentage of mutations in OSCC patients and OSCC cell lines are shown on the left. Mutation types are indicated on the bottom

