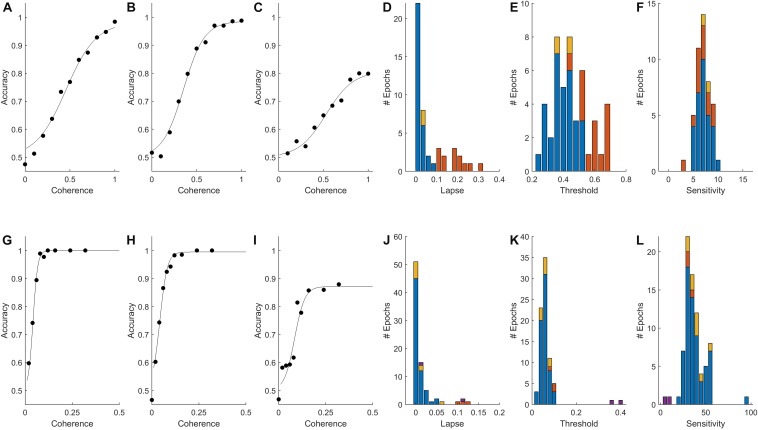
FIGURE 1.
Psychometric functions of rat and human populations. (A–C,G–I) Accuracy (fraction correct) as a function of stimulus strength (coherence) for three rats (A–C) and three humans (G–I) from our data set. Points indicate fraction correct among trials at the indicated coherence. Curves are psychometric fits, from which we obtain lapse (extrapolated error rate at 100% coherence), threshold (coherence at 75% correct), and sensitivity (slope of psychometric curve) for each epoch (see section Materials and Methods). (D,J) Distribution of lapse among qualifying epochs of rats and humans respectively (see Materials and Methods for inclusion criteria). (E,K) Distribution of motion discrimination threshold. (F,L) Distribution of motion sensitivity; note different scales. In all histograms in this figure, blue indicates epochs with <10% lapse and no bias; red indicates epochs with >10% lapse (e.g., C,I), some of which were also biased; yellow indicates epochs with response bias but not lapse; and purple indicates an atypical visually impaired human subject. The outlier near 100 in (L) is the example shown in (G).

