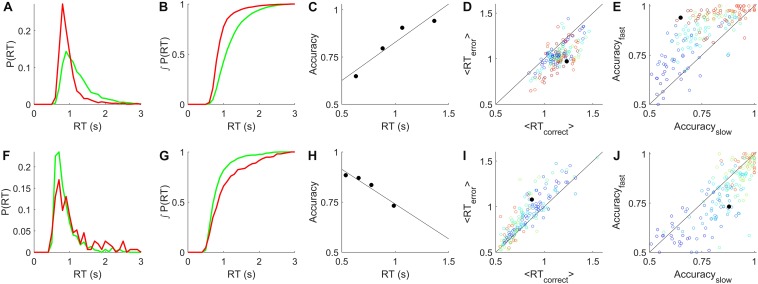
FIGURE 2.
Relationship between reaction time and accuracy. (A) Example reaction time probability distributions from a rat single-coherence experiment, N = 10,858 trials, 82% correct. Green = correct trials, red = error trials. (B) Cumulative distributions, the integrals of curves in (A). (C) Accuracy vs. reaction time quartiles (symbols) and linear regression to these points (line), for the data shown in (A,B). (D) Average reaction time of correct trials vs. of error trials in rat data. Each symbol represents analysis of all trials of like coherence from one non-trending, unbiased epoch. Colors indicate coherence from 0.1 (blue) to 0.85 (red). Black filled circle represents the data shown in (A–C). (E) Accuracy of slow trials vs. fast trials from rat epochs described in (D). Slow and fast defined as the bottom and top quartiles of reaction time respectively for that coherence in that epoch. Symbols as in (D). (F) Example reaction time probability distributions from a human subject from a single-coherence epoch with N = 909 trials, 83% correct, colors as in (A). (G) Cumulative distributions, the integrals of curves in (F). (H) Accuracy vs. reaction time for data in (F,G). (I) Average reaction times of correct vs. error trials from human epochs selected as described in (D), also excluding the visually impaired human subject. Analyzed as in (D); symbols as in (D) except that coherence scale is 0.02 (blue) to 0.16 (red). (J) Accuracy of slow vs. fast responses for human experiments, analyzed as described in (E), symbols as in (I). Additional details in section “Materials and Methods.”

