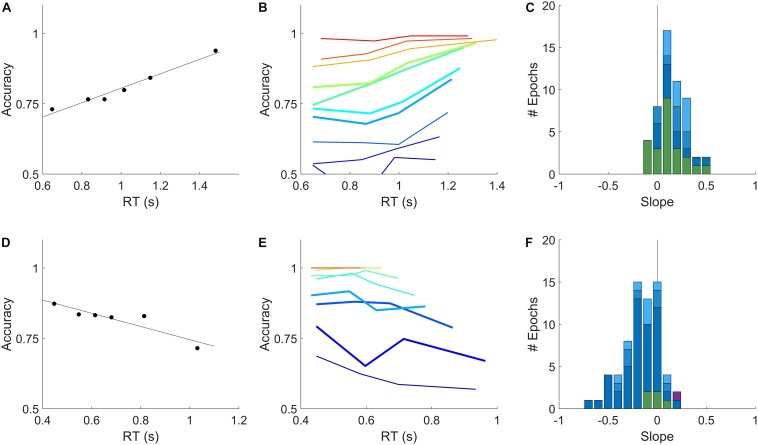
FIGURE 3.
Relation of accuracy to reaction time is opposite in rats and humans. (A) Dependence of accuracy on reaction time for an example rat subject evaluated within a single epoch for all trials within the sensitive range (70–90% correct) of psychometric curve. Symbols show mean accuracy and mean reaction time, in reaction time bins with equal numbers of trials; the slope of the linear regression (line) was +0.26 for this epoch. (B) Accuracy vs. reaction time for the same data as in (A), computed separately by coherence. Color indicates coherence, 10–100% coherence (blue→red). Thick curves indicate the coherences pooled in (A). This epoch contained 8149 qualifying trials. (C) Distribution of slopes computed as in (A), for all qualifying rat epochs (see section Materials and Methods). Colors indicate epochs with <1% lapse (dark blue, N = 12), 1–2% lapse (medium blue, N = 8), 2–10% lapse (pale blue, N = 10), or fixed coherence (green, N = 23). (D) Dependence of accuracy on reaction time for an example human subject within a single epoch, analyzed as described in (A). Slope was –0.23 for this epoch. (E) Data from the example human subject in (D), analyzed as in (B). Coherences 2–32% (blue→red). This epoch contained 5652 qualifying trials. (F) Distribution of slopes in all qualifying human epochs: <1% lapse (N = 46), 1–2% lapse (N = 7), 2–10% lapse (N = 8) and fixed coherence (N = 5) colors as in (C); visually impaired subject (N = 1) in purple. Details of analysis are in section “Materials and Methods.”

