Figure 4.
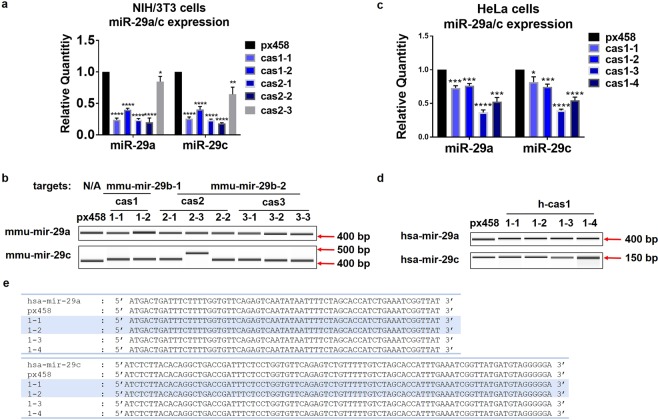
miR-29b knockdown decreased mature miR-29a/c expression levels, however did not change miR-29a/c genome sequences. (a) qRT-PCR assay showed that the mature levels of miR-29a and miR-29c were significantly downregulated in clones cas1-1, cas1-2, cas2-1 and cas2-2 compared to px458. The data shown represent the mean change with standard deviation from three times sample collection. Statistical analysis was performed using student t-test. *p < 0.05, **p < 0.01, ****p < 0.0001. (b) Surveyor assay detecting the changes on the nucleotide sequences of mmu-mir-29a and mmu-mir-29c were performed using primers designed spanning the genes locus. mmu-mir-29a displayed no changes among clones; mmu-mir-29c showed an increase in clone cas2-3. (c) qRT-PCR detected the downregulation of mature miR-29a and miR-29c in all four HeLa clones. Data shown represent the mean change with standard deviation from three experiments. Statistical analysis was performed using student t-test. *p < 0.05, ***p < 0.001, ****p < 0.0001. (d) Surveyor assay showed that no significant cleavage occurred on hsa-mir-29a/c sequences. (e) Sanger sequencing displayed no nucleotide changes on the genome locus of hsa-mir-29a and hsa-mir-29c. Surveyor assay products were visualized on Bioanalyser equipment using DNA 1000 chip. Full-length Bioanalyser images for (b,d) are presented in Supplementary Fig. 6.

