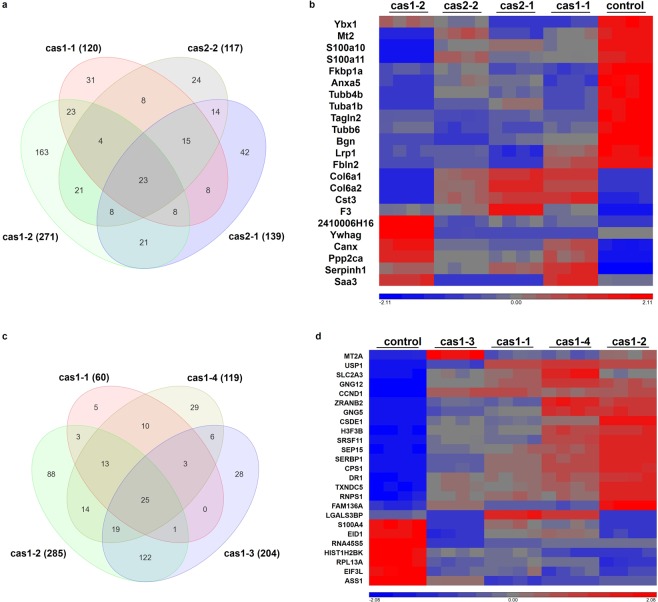
Figure 6.
Differential gene expressions following miR-29b knockdown in NIH/3T3 and HeLa clones. DGEs assay was performed using Partek Genome Suite platform, with p value set less than 0.05. (a) The venn diagram displayed the numbers of DGEs in NIH/3T3 clones compared to px458. 23 genes were overlapped from all clones. (b) Heatmap showing the overlapped genes expressions in NIH/3T3 cell clones. (c) The venn diagram displayed the numbers of DGEs in HeLa clones compared to px458. 25 genes were overlapped from all clones. (d) Heatmap showing the overlapped genes expression across all HeLa cell clones.

