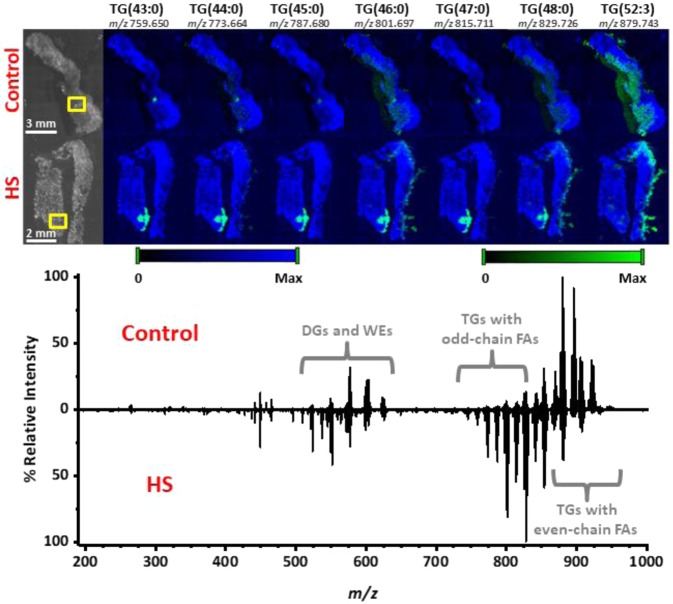
Figure 2.
MS images acquired from 5 µm thick control (top row) and HS diseased (bottom row) tissue sections using NAPA-LDI-MSI. Chemical images (green channel) are overlaid onto a false-color representation of the optical image (blue channel). Ion intensity values were scaled equally between the two tissue types. Comparison of spectra obtained by averaging 8 MS scans from the hair follicle/apocrine sweat gland region (outlined in yellow boxes) of both tissue types. All TG lipids were detected as sodium adducts with a mass error of <5 mDa. Plots were produced by Origin 2019b.

