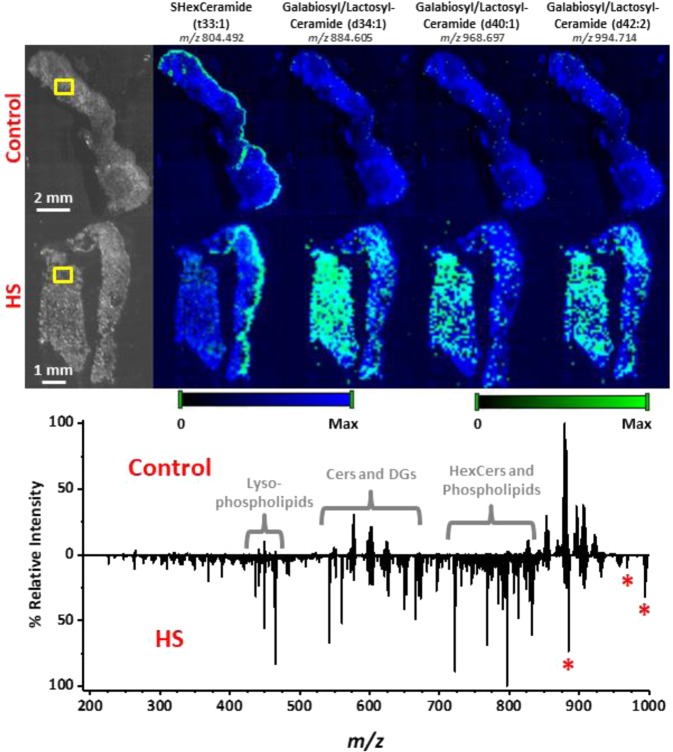
Figure 3.
MSI analysis of 5 µm thick control (top row) and HS diseased (bottom row) tissue sections using NAPA-LDI-MSI. The selected chemical images show the spatial distributions of detected galabiosyl-/lactosylceramides (denoted by red asterisks), which were shown statistically to be present at remarkably higher levels in the HS diseased tissue. Chemical images (green channel) are overlaid onto a false-color representation of the optical image (blue channel). To help with visual orientation of the tissue sections, a chemical image of m/z 804.492, detected along the epidermis and tentatively assigned as SHexCer (t33:1) based on accurate m/z, is included. Comparison of spectra obtained by averaging 8 MS scans from the dermis region of both tissue types (outlined in yellow boxes). Ion intensity values were scaled equally between the two tissue types. All lipids were detected as sodium adducts with a mass error of <5 mDa. Plots were produced by Origin 2019b.

