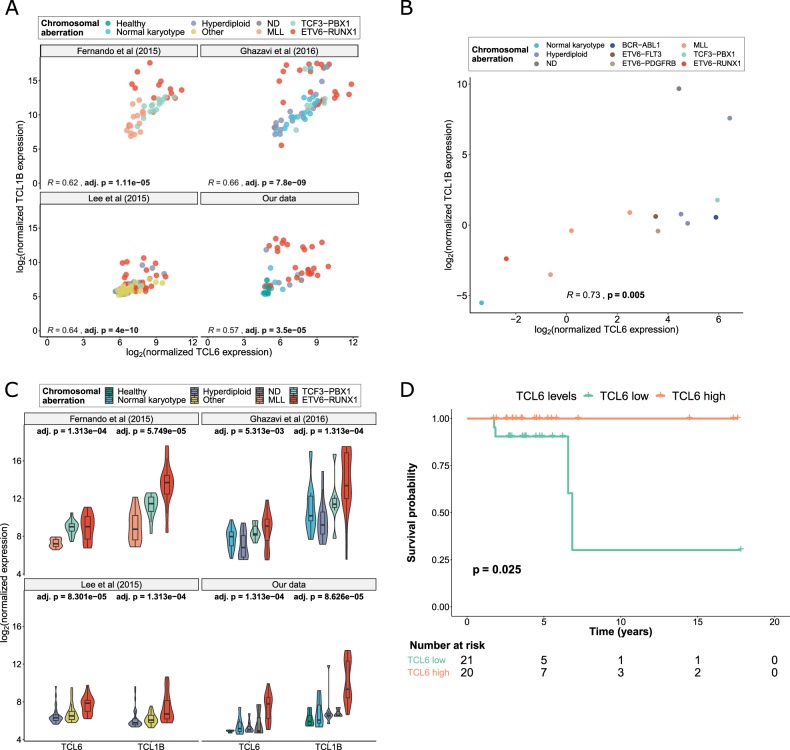
Fig. 2. Validation of the relevance of TCL6/TCL1B in pediatric B-ALL.
a Correlation analysis of TCL6/TCL1B in independent datasets of pediatric B-ALL patients. The points are colored according to the genomic aberration of the samples. The p-values were adjusted using the Benjamini–Hochberg method. Sample sizes: n = 46 for our data, n = 80 for Lee et al.8, n = 64 for Ghazavi et al.5, n = 44 for Fernando et al (2015). b. Correlation analysis of TCL6/TCL1B in the Cancer Cell Line Encyclopedia (CCLE), n = 13. The points are colored according to the genomic aberration of the samples. c. Validation of the differential expression of TCL6 and TCL1B in three independent external B-ALL cohorts. Sample sizes: n = 46 for our data, n = 80 for Lee et al (2015), n = 64 for Ghazavi et al (2016) and n = 44 for Fernando et al.6. Kruskal–Wallis FDR-adjusted p-values are shown. d Kaplan–Meier curve of pediatric B-ALL patients divided in two groups: “TCL6 high” and “TCL6 low”, based on whether TCL6 expression was above or beyond the median. The logrank p-value is shown.

