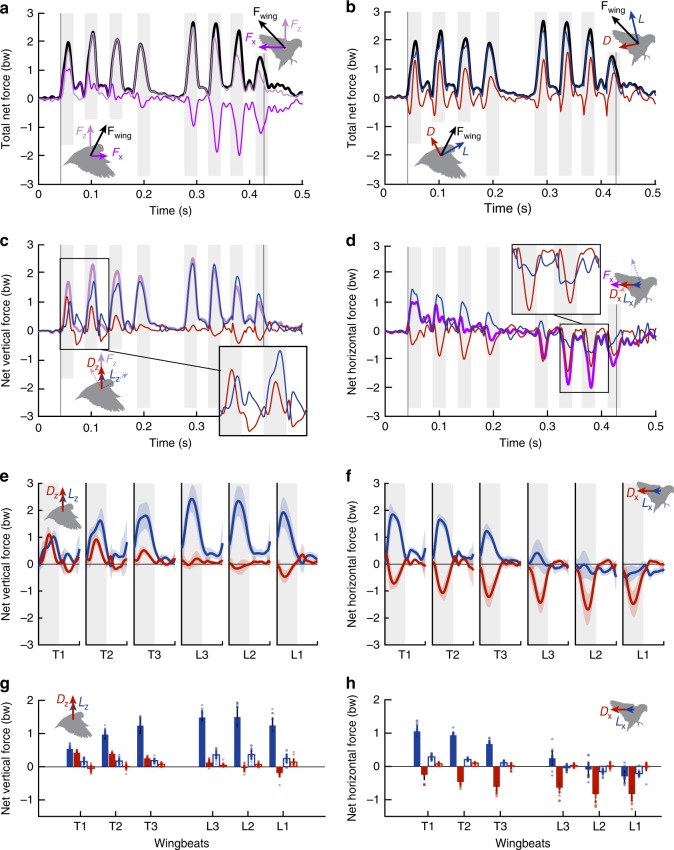
Fig. 3.
Lift can do more than lift, and drag may not be a drag. a The net force from both wings (black) is recovered by the vectoral sum of the net horizontal (purple) and vertical forces (light purple) measured in the AFP. Forces are normalized by bodyweight bw. Gray-shaded regions show downstrokes, vertical lines show when perch toe-off and touchdown occur. b While net lift (blue) forces tend to be greater than net drag (red) forces, both components contribute significantly to the total net force. c The nearly vertical stroke plane after takeoff results in comparable vertical force contributions from both drag and lift during takeoff wingbeats (inset). During later wingbeats, vertical forces are predominately generated through lift. d Lift first pitches forward to accelerate the bird and counter drag during takeoff. During landing, lift pitches backward to augment braking forces generated by drag (inset). a–d correspond to the same example flight from Fig. 2. Net forces are omitted from insets in (c, d) to enable better comparison between lift and drag contributions. e, f Time-resolved mean ± s.d. force traces (N = 5 birds, n = 4 flights per bird) show the contributions of lift and drag to the net vertical (e) and horizontal (f) forces during the first three wingbeats after takeoff (T1, T2, T3) and the final three full wingbeats before landing (L3, L3, L1). g, h Stroke-averaged net forces during takeoff and landing wingbeats show how aerodynamic force is generated primarily during downstrokes (filled bars) rather than upstrokes (open bars). g While downstroke lift provides the majority of the total weight support, drag also contributes significant vertical force during initial downstrokes, as does upstroke lift throughout each flight. h Horizontal accelerating forces are derived primarily from downstroke lift, while braking forces are derived from downstroke drag. Lift also provides braking force during the final two wingbeats. Bars and error bars show mean ± s.d. for N = 5 birds, n = 4 flights per bird (overlaid dots show individual flights). Source data are provided as a Source Data file.

