Fig. 6.
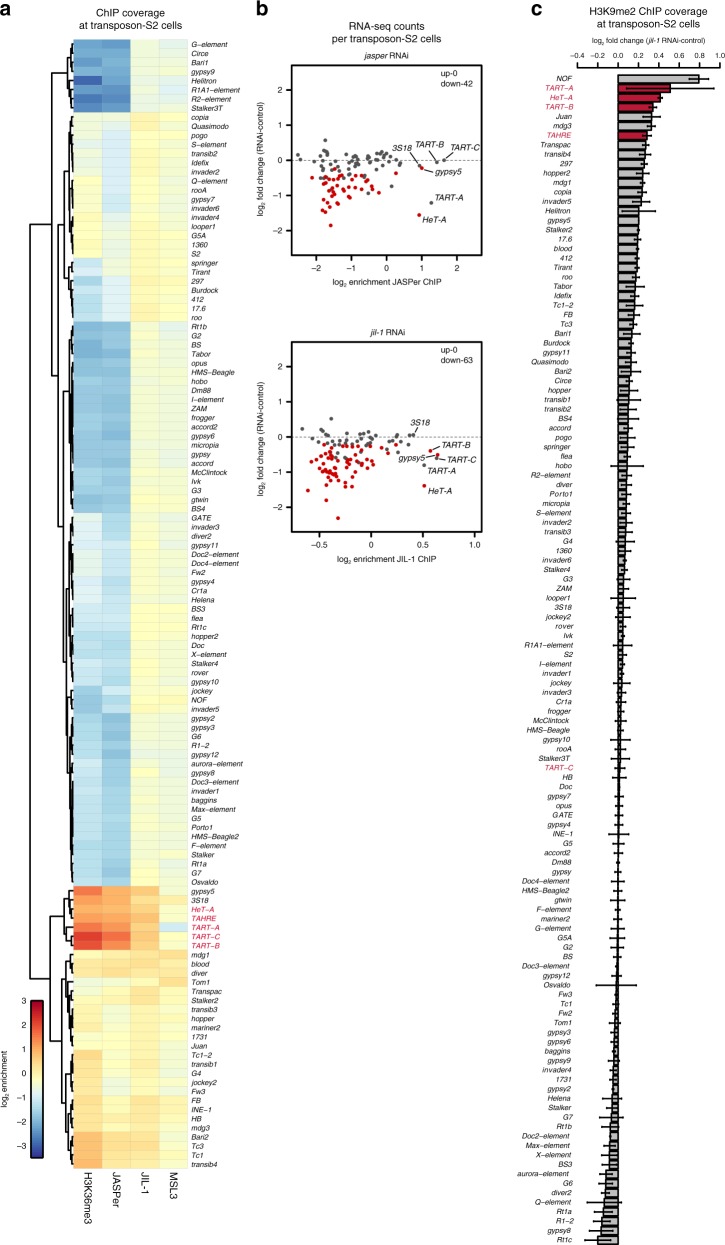
JIL-1 and JASPer depletion in S2 cells decrease the transcript level of transposons of the telomeric transposons of the HTT arrays. a Heatmap showing mean normalized log2 enrichment in H3K36me3 (n = 4), JASPer (n = 4), JIL-1 (n = 5), and MSL3 (n = 3) MNase ChIP-seq at transposons (n = 124) in male S2 cells. Transposons of the HTT array are marked in red. b Scatter plot showing mean log2 fold-change of RNA-seq counts upon jasper RNAi versus control and jil-1 RNAi versus control against mean normalized log2 enrichment in JASPer (n = 4, upper panel) and JIL-1 (n = 5, lower panel) MNase ChIP-seq, respectively, at robustly detected transposons in male S2 cells (n = 111). Statistically significant differentially expressed transposons between RNAi and control conditions (fdr < 0.05) are marked in red and the number of significant genes is indicated on the plot. TEs of the HTT arrays, gypsy5, and 3S18 are labeled. c Bar plot of difference of mean H3K9me2 (n = 3 each) spike-in ChIP-seq normalized coverage after jil-1 RNAi treatment and control male S2 cells at transposons (n = 124) in male S2 cells. Error bars represent standard error of the mean. TEs of the HTT arrays are marked in red.

