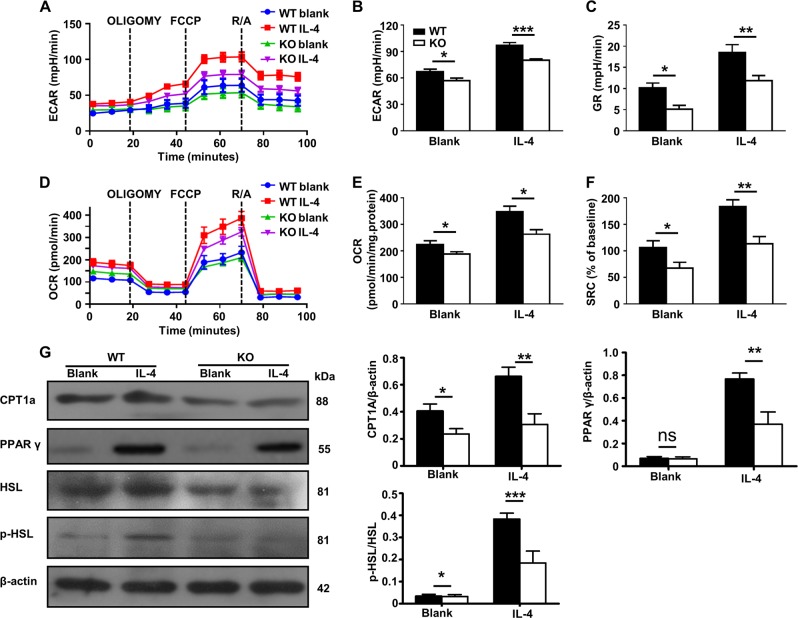
Fig. 6. Ubc9 deficiency impairs glycolysis and mitochondrial respiration, which are essential for M2 polarization.
ECARs at baseline and after sequential treatment with oligomycin (Oligo) and FCCP a, ECAR values b, and GR values c are shown in the bar graph. OCRs at baseline and after sequential treatment with oligomycin (Oligo) and FCCP d, OCR values e, and SRC values f are shown in the bar graphs. g Western blotting was used to analyze the protein expression of CPT1a, PPAR γ, and phosphorylated HSL. The intensities of the CPT1a, PPAR γ, and phosphorylated HSL protein signals relative to the intensity of the β-actin signal are shown in the bar graphs. Results are means ± SEM from three independent experiments conducted. *P < 0.05; **P < 0.01; ***P < 0.001; and ns not significant.

