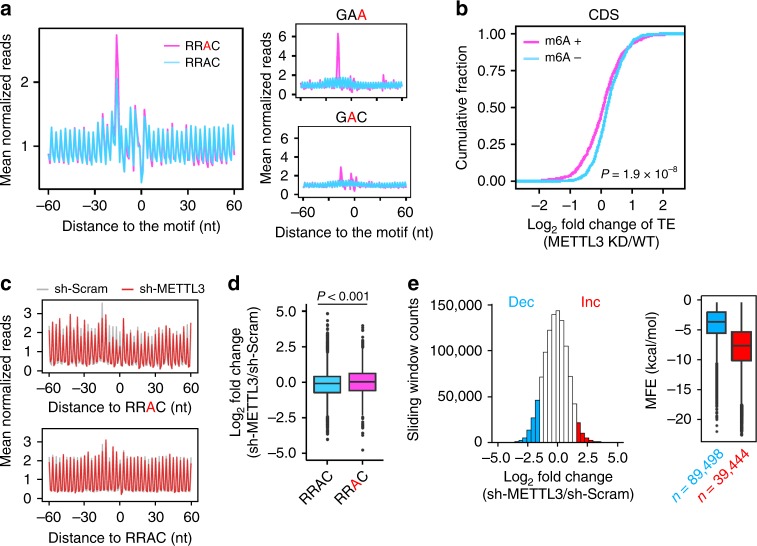
Fig. 2.
Characterize the role of CDS m6A in translation efficiency. a Aggregation plots show the mean ribosome densities along mRNA regions aligned to the RRAC motif with (pink line) or without (blue line) m6A modification. Right panels show the mean ribosome densities along mRNA regions aligned to GAA or GAC codons with (pink line) or without (blue line) m6A modification. A minus position value indicates upstream of m6A sites, whereas a positive value indicates downstream of m6A sites. The m6A site in RRAC motif or codons is highlighted by red. b The fold change of translation efficiency upon METTL3 knockdown is plotted as accumulative fractions (Wilcox test, P = 1.9 × 10⁻⁸) for mRNAs bearing CDS methylation (m6A+) or not (m6A−). Both groups have similar levels of basal TE. c Aggregation plots show the mean ribosome densities along mRNA regions aligned to the RRAC motif with (top panel) or without (bottom panel) m6A modification. Plots from cells with or without METTL3 knockdown are color coded. The m6A site in RRAC motif is highlighted by red. d From the same data sets as c, the fold change of ribosome accumulation upstream of the motif in response to METTL3 knockdown is calculated for transcripts with or without m6A modification (Wilcox test, P < 0.001). For the boxplot in d and e, the median value in each group is indicated by a center line, the box shows the upper and lower quantiles, whiskers shows the 1.5× interquartile range, and the outliers are indicated by points. e A histogram shows the distribution of changes of regional ribosome density in response to METTL3 knockdown. A sliding window of 30 nt in length with a step of 3 nt are used to calculate the local ribosome density. Regions with <1/3-fold (Dec, blue) and >3-fold (Inc., red) changes are highlighted by color coding. The right box plot shows the predicted minimum folding free energy (MFE) for regions with <1/3-fold (Dec) and >3-fold (Inc.) changes (Wilcox test, P < 2.2 × 10⁻¹⁶). Source data are provided as a Source Data file.

