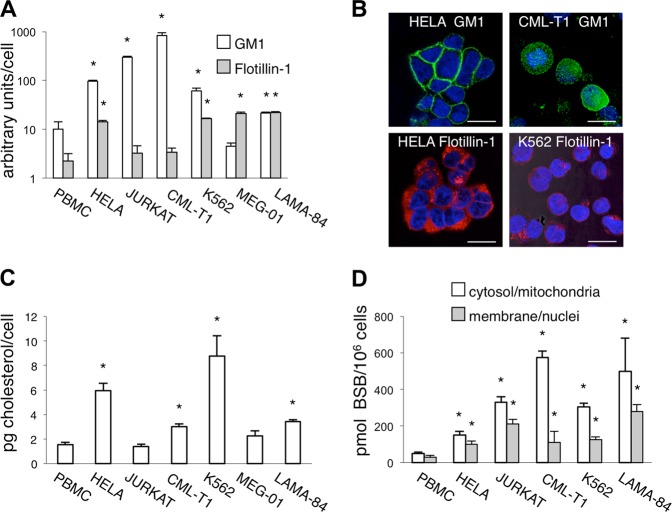
Fig. 1. Lipid rafts and BSB uptake.
a Expression of GM1 and flotillin-1 as assessed by flow cytometry in different cell types. Data were expressed as arbitrary units dividing the MFI by the median forward scatter (size) in each sample. *p < 0.05, as compared to PBMC. b Immunofluorescence detection of GM1 (Alexa Fluor 488) and Flotillin-1 (Cy-3) on different cell types. Samples were counterstained with DAPI and visualized by confocal microscopy. Magnification 63×. Scale bar: 17 μm. c Plasma membrane content of cholesterol. *p < 0.05 as compared to PBMC. d BSB concentrations in cellular compartments of different cells treated with 40 µM BSB for 24 h. *p < 0.05, as compared to PBMC. Mean values and s.d. of five independent determinations for each cell type were plotted.

