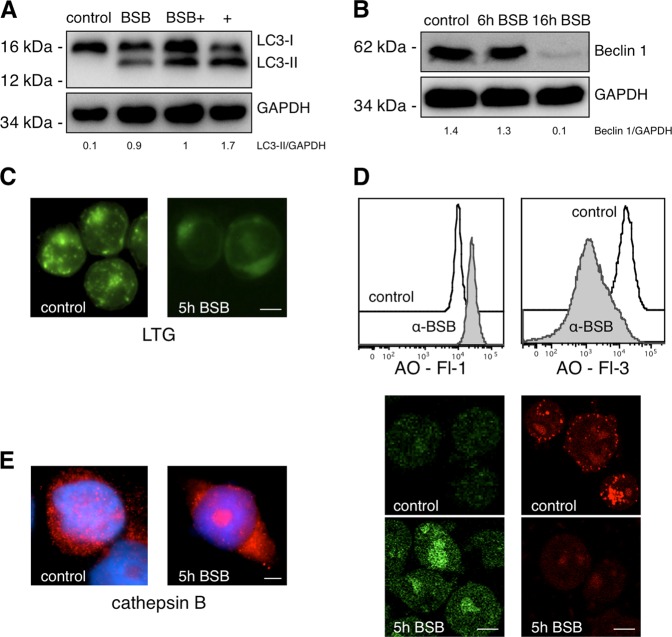
Fig. 4. Autophagy impairment and lysosomal collapse induced by BSB.
a Expression of LC3-I and LC3-II in Jurkat cells left untreated (control) or treated for 16 h with BSB, BSB plus pepstatin A and E-64D (BSB+), or pepstatin A and E64D without BSB (+). b Expression of Beclin 1 in Jurkat cells treated or not with BSB for 6 and 16 h. c Fluorescence microscopy of lysosomal destabilization evaluated by LTG-uptake assay in Jurkat cells. Shown is the shift from a punctate staining (intact lysosomes from untreated cells) to a diffuse cytoplasmic signal (disrupted lysosomes from treated cells). Scale bar: 12 μm. d Flow cytometry and fluorescence microscopy assessment of lysosomal membrane permeabilization. AO-relocation assay (left): Jurkat cells stained with the metachromatic fluorophore AO were exposed to 80 µM BSB for 5 h. Leakage of lysosomal content into the cytoplasm was measured as an increase in green fluorescence (control 11,590 ± 1243 vs treated 17,185 ± 2532, p < 0.05). AO-uptake assay (right): Cells treated with 80 μM BSB for 5 h were stained with AO. Reduced lysosomal AO accumulation was measured as a reduction in red fluorescence (control 15,290 ± 2379 vs treated 1600 ± 200, p < 0.001). Scale bar: 12 μm. e Fluorescence microscopy evaluation of the lysosomal protease cathepsin B after 5-h treatment of Jurkat cells with 80 µM BSB. Cathepsin B was released into the cytosol upon BSB stimulation, as evidenced by the diffuse fluorescence pattern. A large cytoplasmic cathepsin B aggregate was also evident. Samples were counterstained with DAPI. Scale bar: 12 μm.

