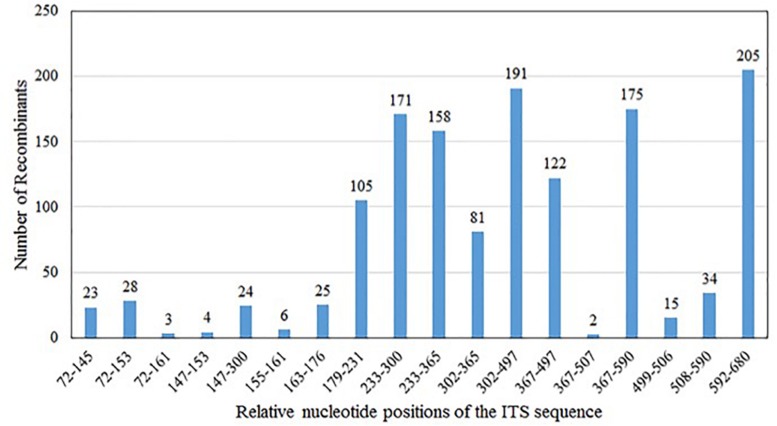
FIGURE 2.
Distribution of in vitro PCR recombination events along the sequenced ITS DNA fragment. In the present study, base positions 1–32 are part of the 18S; positions 33–324 (type A), and 33–323 (types B and C) represent ITS1; positions 325–478 (type A) and 324–477 (types B and C) represent 5.8S; positions 479–694 (type A), 478–693 (type B), and 478–692 (type C) represent ITS2; and positions 695–731 (type A), 694–730 (type B), and 693–729 (type C) are part of the 26S. Because of the different lengths of types A, B, and C sequences, their aligned dataset was used to infer the regions where recombination occurred. Type A and C have the same 5.8S gene sequence, while type B has a different base at the position 366, adenine for type A and C, guanine for type B.

