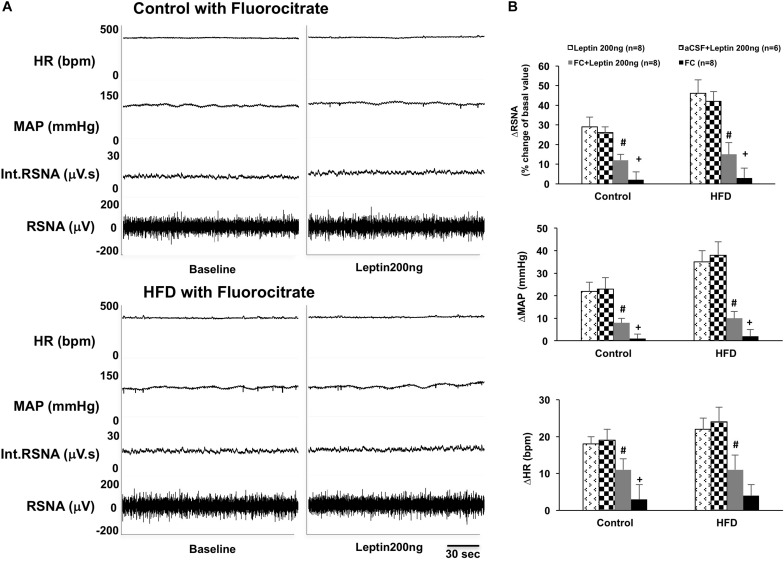
FIGURE 2.
(A) Representative tracer of RSNA, int.RSNA, MAP, and HR responses to microinjection of leptin with fluorocitrate in the ARCN of the control and HFD rat. (B) Mean changes in RSNA, MAP, and HR to microinjection of leptin (200 ng) with and without fluorocitrate in the ARCN. # P < 0.05 vs. the leptin group without fluorocitrate. +P < 0.05 vs. the FC + leptin group. FC: fluorocitrate.

