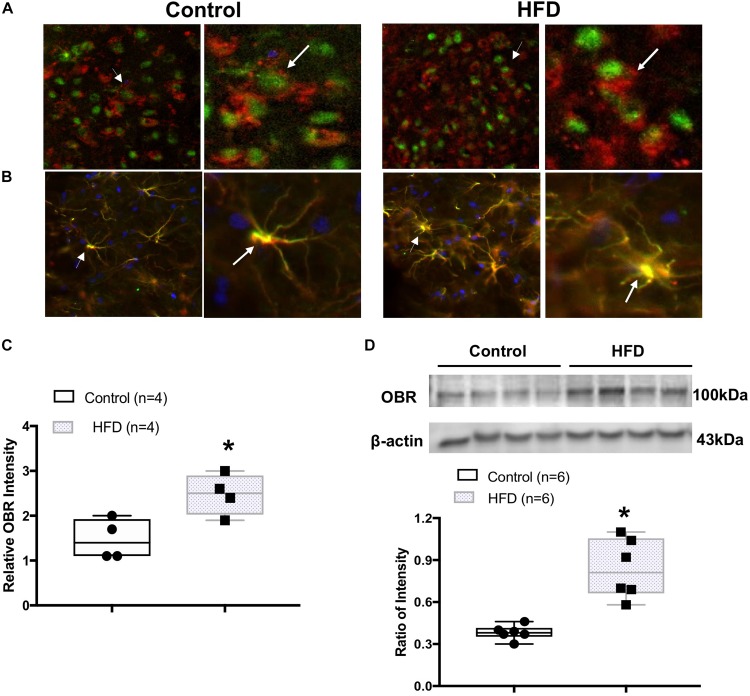
FIGURE 3.
(A) Immunofluorescent photomicrographs from the sections of the ARCN region stained for leptin receptor (OBR, in red), neuronal marker NueN (in green), and 4′,6-diamidino-2-phenylindole (DAPI, in blue) in a control and an HFD rat (X200). Amplified images are shown in the right panel. Arrow indicates the localization of OBR in the NeuN-labeled cell. (B) Immunofluorescent photomicrographs from the sections of the ARCN region stained for OBR (in red), glial marker glial fibrillary acidic protein (GFAP, in green), and DAPI (in blue) in a control and an HFD rat (X200). Amplified images are shown in the right panel. Arrow indicates the colocalization of OBR and GFAP. (C) Mean intensity of OBR staining signal in the ARCN of control and HFD rats. (D) Representative gel of OBR and mean protein expressions in the ARCN of control and HFD rats. ∗P < 0.05 vs. control group.

