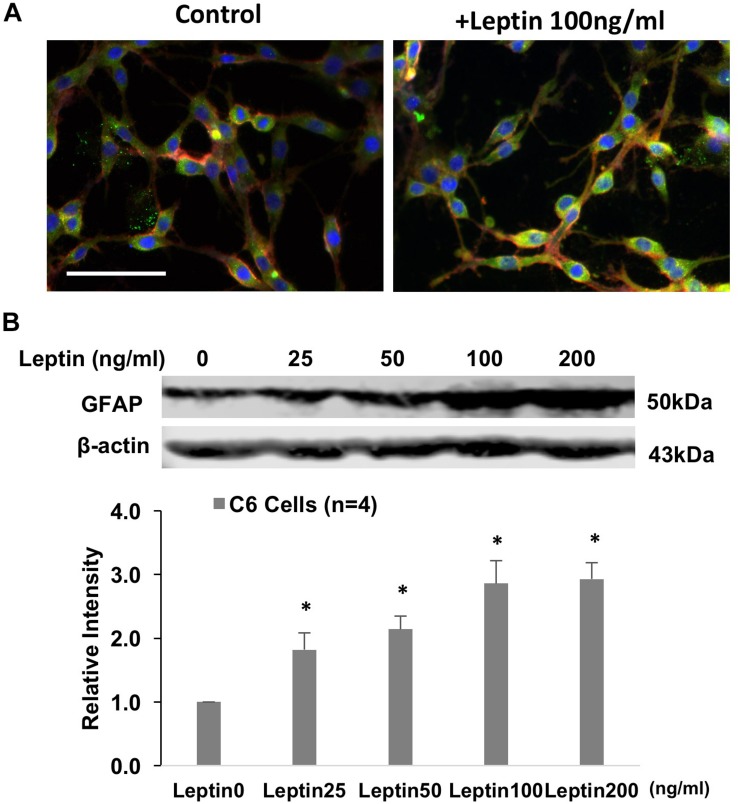
FIGURE 6.
(A) Immunofluorescent photomicrographs from the cultured astrocytic C6 cells stained for GFAP (green), OBR (red), and DAPI (blue) with/without leptin treatment. Bar = 50 μm. (B). Representative gel and mean protein expressions of GFAP in the C6 cells with leptin treatment. ∗P < 0.05 vs. control without leptin treatment.

