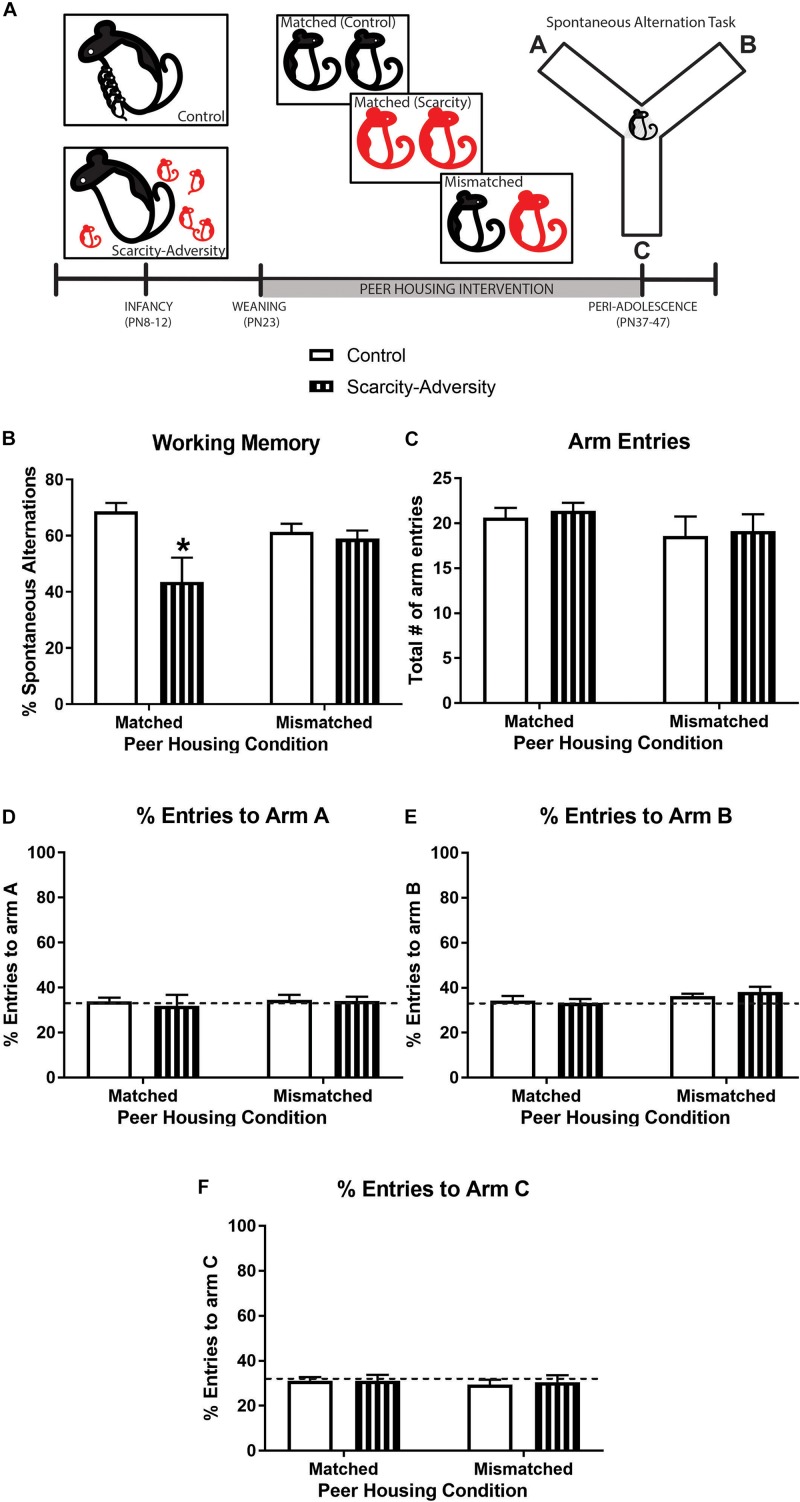
FIGURE 2.
A peer housing intervention rescued spatial working memory following early-life scarcity–adversity exposure. (A) Experimental timeline. (B) Mean (± SEM) levels of percent spontaneous alternation in the spontaneous alternation task (∗significantly different from all groups, p < 0.05, n = 7–8/group). (C) Mean (± SEM) levels of total number of maze arm entries during spontaneous alternation task (n = 7–8/group). (D) Mean (± SEM) percent levels of entries into arm A of the Y-maze during the spontaneous alternation task (dotted line represents level of entries at 33%; n = 7–8/group). (E) Mean (± SEM) percent levels of entries into arm B of the Y-maze during the spontaneous alternation task (dotted line represents level of entries at 33%; n = 7–8/group). (F) Mean (± SEM) percent levels of entries into arm C of the Y-maze during the spontaneous alternation task (dotted line represents level of entries at chance, i.e., 33%; n = 7–8/group).

