Figure 4.

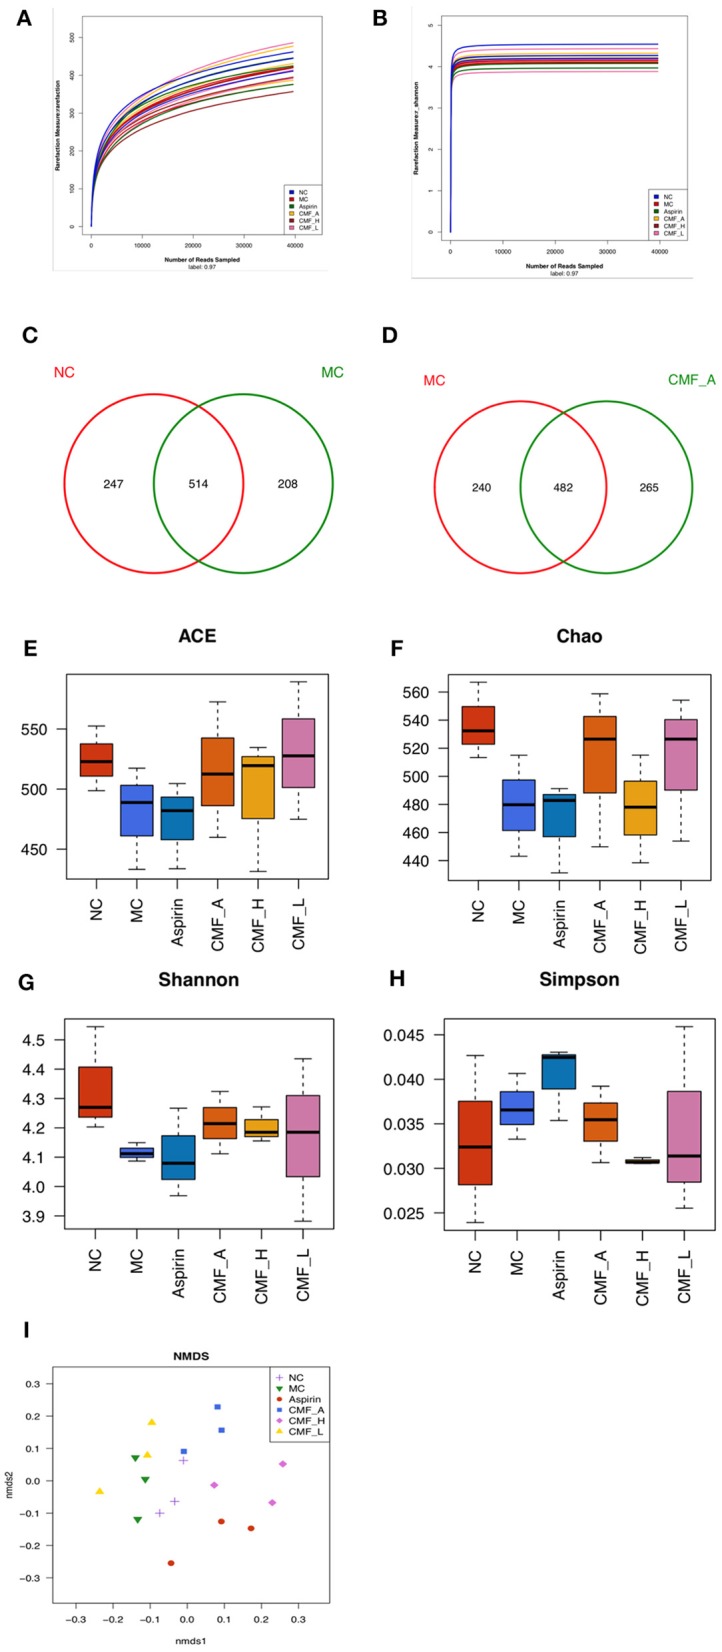
Illumina Miseq sequencing data showed CMF modulates the overall component of gut microbiota. (A) Rarefaction curves determined at the 97% similarity level. (B) Shannon-Wiener curves of samples, calculated using mothur. (C–F) Venn diagram of OUTs in the different groups. (G–I) Community richness and diversity index of the model control group (MC), normal control group (NC), aspirin group, and CMF intervention groups (CMF-A/H/L) on ACE, Chao, Shannon, Simpson analysis.
