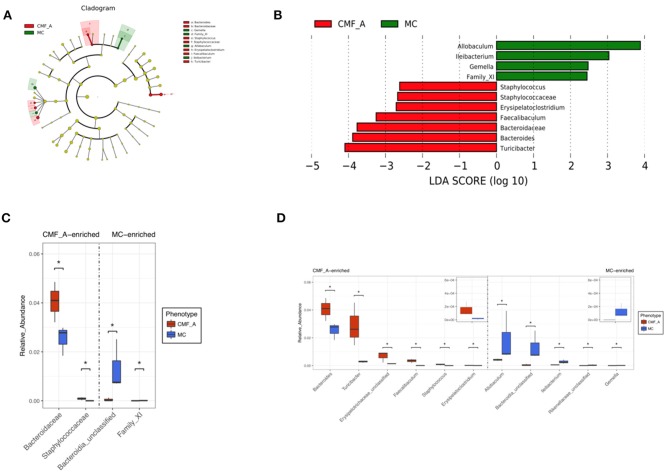
Figure 6.
Comparison of gut microbiota between CMF-A group and MC group. Cladogram of linear discriminant analysis (LDA) coupled with effective size measurement showing differentially abundant genera (A). Histogram of LDA scores for differentially abundant genera (B). qPCR identified the difference in CMF-A group and MC group of mice and t-test for significance testing at family level (C) and genus level (D). Superscript letters indicate statistical differences (*P < 0.05).

