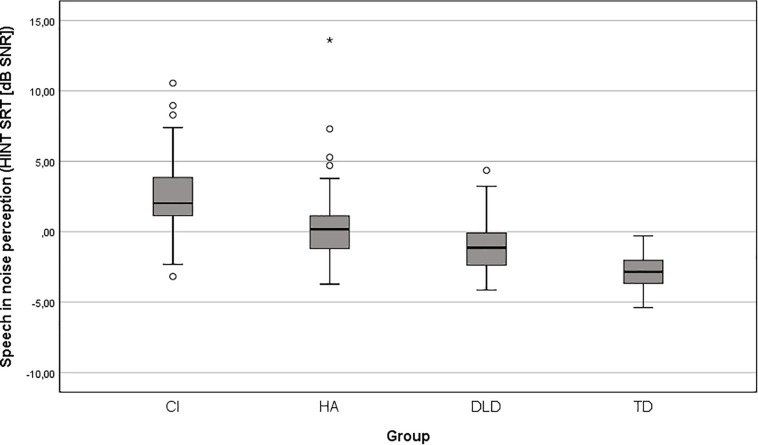
FIGURE 2.
Boxplot of age-adjusted HINT SRTs for children with CI, HA, DLD, and TD. The boxes go from the first quartiles to the third quartiles. Outliers were defined using Tukey (1977) i.e., as any data points more than 1.5 times the interquartile range from the quartiles. The whiskers go from the smallest non-outlier to the largest non-outlier.

