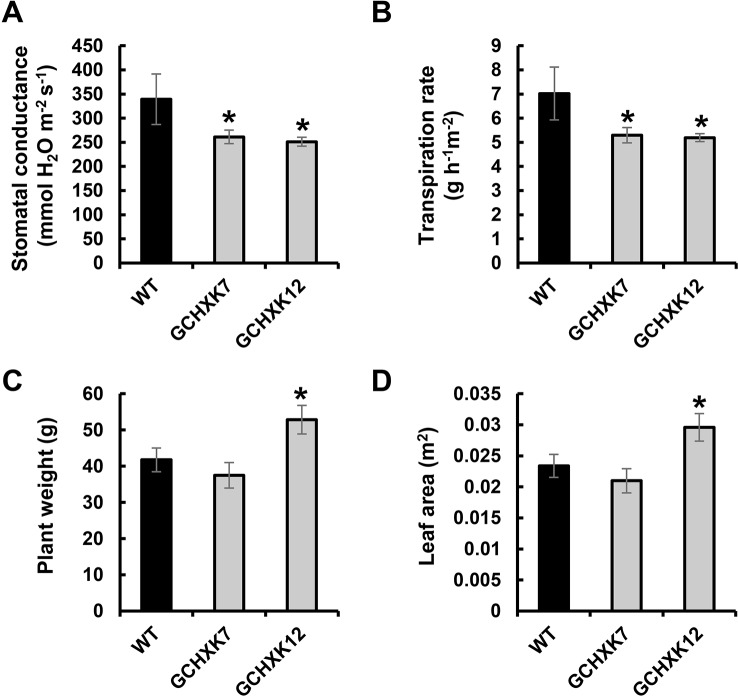
Figure 3.
Transpiration, stomatal conductance and biomass accumulation of GCHXK tomato plants as determined using the lysimeter system. (A) Whole-canopy stomatal conductance, (B) transpiration rate, (C) total plant fresh weight, and (D) total leaf area of wild-type (WT, black columns) and two independent transgenic GCHXK lines (GCHXK7, GCHXK12, gray columns) under well-watered conditions. (A–D) Data are means of eight independent biological replicates ± SE. Asterisks denote significant differences relative to the WT (Dunnett’s test, P < 0.05).

