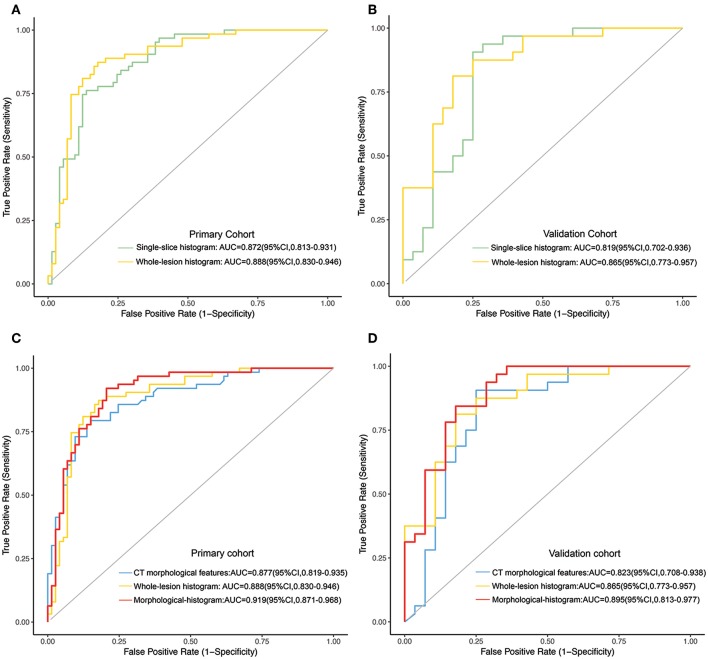
Figure 3.
(A,B) The ROC curves of the single-slice histogram model and whole-lesion histogram model in the training (A) and validation sets (B), respectively. (C,D) The ROC curves of the CT morphological model, the whole-lesion histogram model and the integrated morphological-histogram model in the training (C) and validation cohorts (D), respectively.

