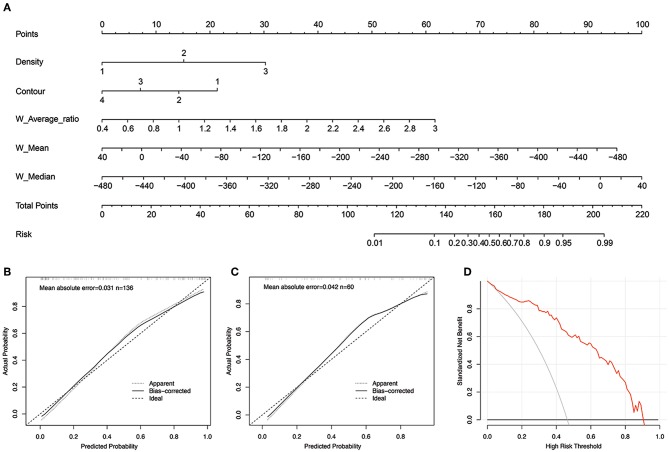
Figure 4.
(A) The developed morphological-histogram nomogram for predicting the probability of pulmonary metastases. By summing the scores of each point and locating on the total score scale, the estimated probability of pulmonary metastases could be determined. (B,C) The Calibration curves for predicting pulmonary metastases in the training and validation cohort. The y axis represents the actual rate of LM. The x axis represents the predicted probability of LM. The ideal line represents a perfect prediction by an ideal model. The apparent line represents the performance of the nomogram model, of which a closer fit to the ideal line represents a better prediction. (D) The decision curves analysis for the morphological-histogram nomogram. The red line represents the net benefit of morphological-histogram model. Across the various threshold probabilities, the morphological-histogram curve showed great net benefit.

