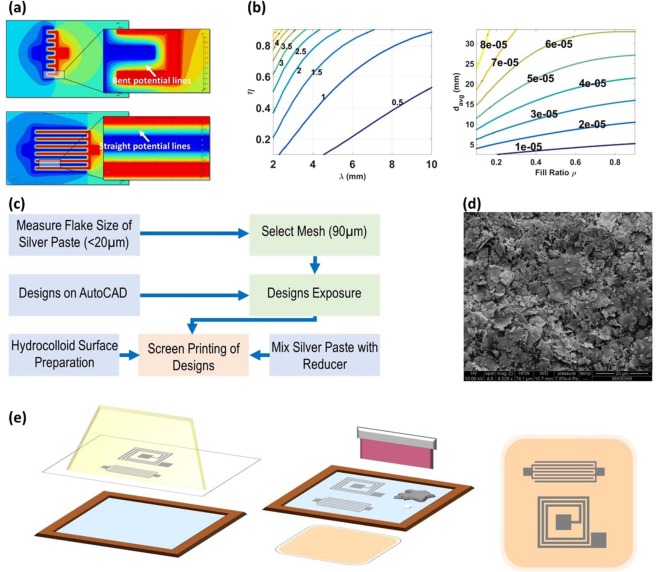
Figure 6.
(a) Potential lines simulation in-between IDC fingers (b)Design contour plot for IDC (pF per cm2) and square spiral on a 10cmx10cm hydrocolloid. (c) Followed methodology for screen-printing (d) SEM micrograph of the Paron-910 silver paste flakes (e) Schematic explaining the process of screen-printing. Blue layer represents the emulsion. Passives designs are exposed to the mesh. Designs are then transferred to the mesh. Silver paste (silver liquid) and reducer (white liquid) are mixed, and the squeegee is used to mix and spread the mixture on the mesh and hence on the hydrocolloid beneath it. The designs are finally screen-printed on hydrocolloid.

