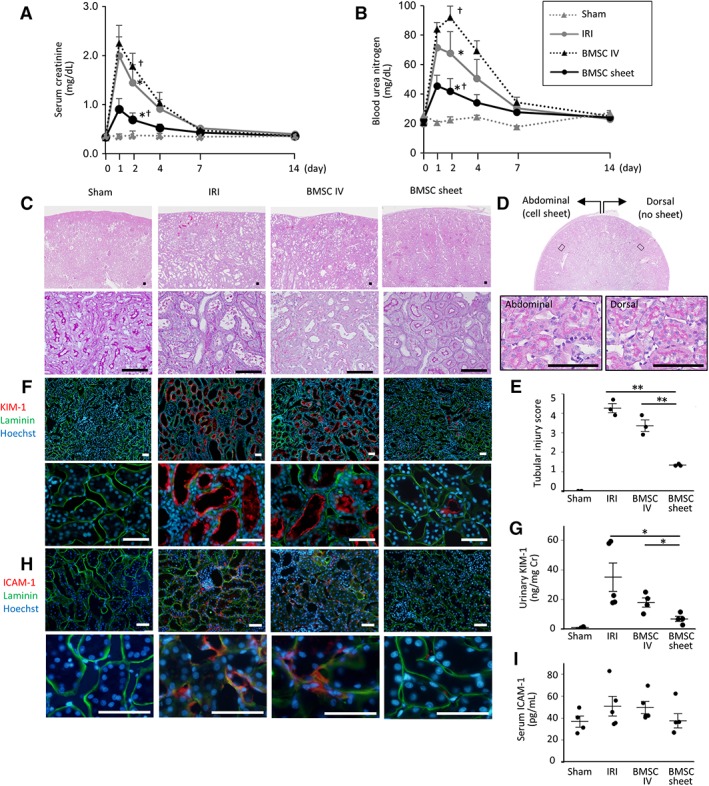
Figure 4.

Assessment of kidney function, tubular, and endothelial injury following bone marrow mesenchymal stromal cell (BMSC)‐sheet transplantation. (A, B): In the BMSC‐sheet group (black lines), elevations in serum creatine and blood urea nitrogen levels were significantly lower than those in the ischemia–reperfusion‐injury (IRI; gray lines) and intravenous (IV; black dotted lines) groups (*, p < .05, IRI vs. BMSC sheet; †, p < .05, BMSC sheet vs. BMSC IV). (C): Periodic acid‐Schiff staining showing severe tubular necrosis in the ischemia–reperfusion‐injury (IRI; black arrow) group, whereas the tubular epithelium is well preserved in the BMSC‐sheet group on day 4. Scale bar: 100 μm. (D): Transverse section of kidney in the BMSC sheet group shows that there was no difference in the histology between abdominal side (with cell sheets) and dorsal side (without cell sheets). (E): Tubular injury score was significantly lower in the BMSC sheet group compared with the IRI and IV groups. (F): The kidney injury molecule‐1 (KIM‐1)‐positive proximal tubule area (shown in red color) in the BMSC‐sheet group was smaller than that of the IRI group. Green is laminin and blue is Hoechst. Scale bar: 100 μm. (G): Urinary KIM‐1 levels were significantly lower in the BMSC‐sheet group than those in the IRI and IV groups. (H): The intercellular adhesion molecule‐1 (ICAM‐1)‐positive endothelial cell area (shown in red color) in the BMSC‐sheet group was smaller than that of the IRI group. Green is laminin and blue is nuclear staining (Hoechst). Scale bar: 100 μm. (I): Serum ICAM‐1 levels tended to be lower in the BMSC‐sheet group than those in the IRI and IV groups; *, p < .05; **, p < .01.
