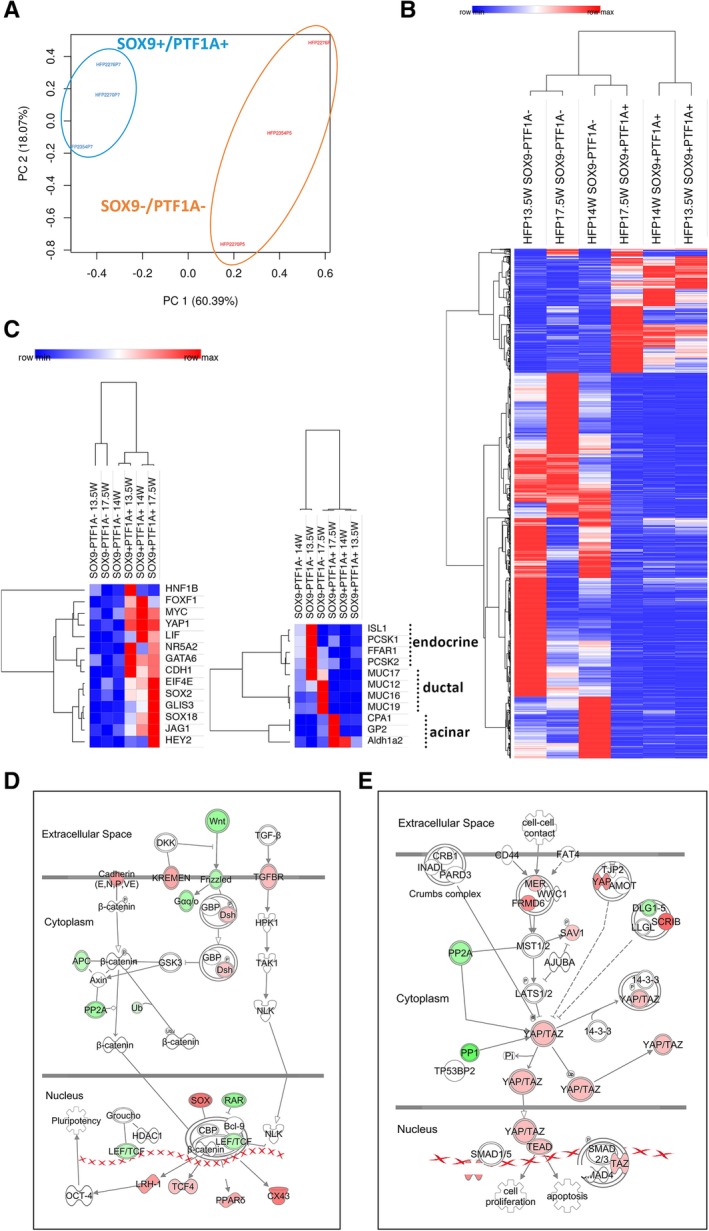
Figure 5.

RNA‐sequencing profiling of SOX9+/PTF1A+ cells. (A): Principal component analysis shows that SOX9+/PTF1A+ populations from n = 3 different hFP samples (respectively, 13.5, 14, and 17.5WGA) cluster together. Negative fractions for the respective isolated populations cluster independently. (B): Heatmap representation of overall gene expression (p < .05, FDR p < .05) for SOX9+/PTF1A+ and SOX9−/PTF1A− cell populations at the indicated GA. Hierarchical clustering shows similarity among the SOX9+/PTF1A+ populations, particularly at 13.5 and 14WGA, with a slight change at the later GA (17.5W). Negative fractions display more variability in terms of overall gene expression. (C): Heat maps of gene expression of markers characteristic of multipotent progenitors (left) and markers of differentiation including endocrine, ductal, and acinar lineages (right). Gene list for multipotent markers: HNF1B, FOXF1, MYC, YAP1, LIF, NR5A2, GATA6, CDH1, EIF4E, SOX2, GLIS3, SOX18, JAG1, and HEY2. Gene list for differentiation markers: ISL1, PCSK1, FFAR1, PCSK2, MUC17, MUC12, MUC16, MUC19, CPA1, GP2, and ALDH1A2. Values are mapped to colors using the minimum (blue) and maximum (red) of each row (gene) independently. IPA analysis of the Wnt/ß‐catenin pathway (D) and the Hippo pathway (E) showing differentially expressed genes between SOX9+/PTF1A+ and the negative counterpart. Upregulated genes are in red, downregulated genes are in green. Genes represented in white were nonsignificant and therefore not detected by IPA analysis. Filters applied for the analysis: p < .05, FDR p < .05, and logFC < −1.5 or >1.5.
