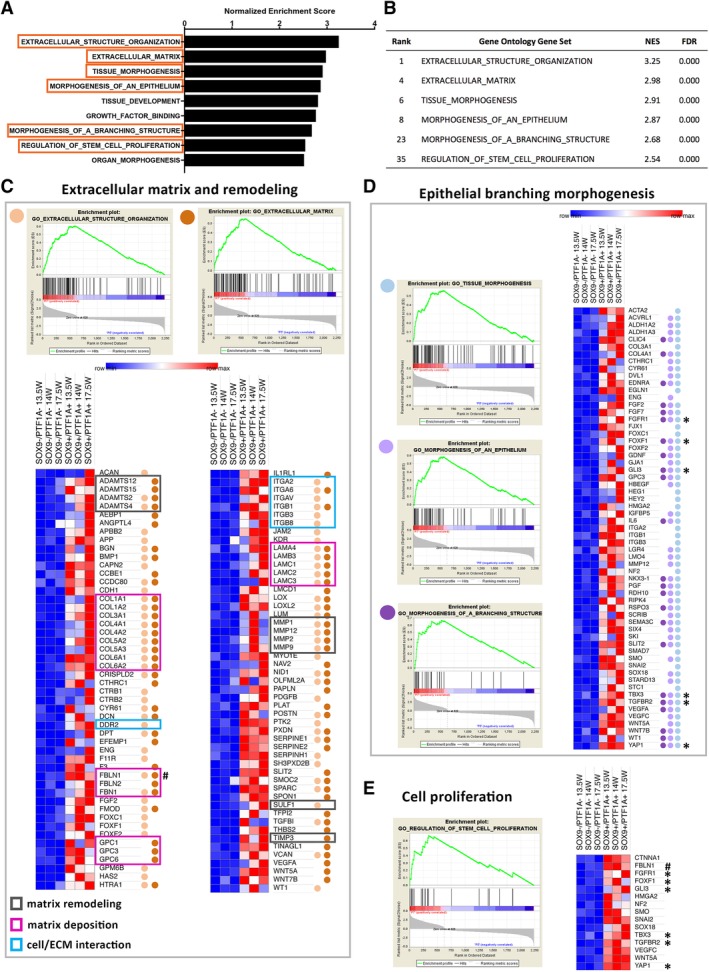
Figure 6.

GSEA of gene expression profiling of SOX9+/PTF1A+ cells. (A): Enriched GO gene sets within SOX9+/PTF1A+ cells belong mostly to ECM processes and tissue development/morphogenesis. (B): List of selected GO gene sets relevant to pancreas development for leading edge analysis, with their respective ranking and normalized enrichment score (NES). FDR, false discovery rate. (C): GO enrichment plots for extracellular matrix deposition and remodeling related gene sets, including GO for extracellular structure organization and extracellular matrix (top). Heat map representation of leading edge analysis for the two gene sets (bottom). Overlap between leading edge subsets is marked by color‐coded dots. Genes with specific functions related to ECM processes have been highlighted to include three main groups: matrix remodeling, matrix deposition, and cell/ECM interaction. (D): GO enrichment plots for epithelial branching morphogenesis‐related gene sets, including GO for tissue morphogenesis, morphogenesis of an epithelium, and morphogenesis of a branching structure (left). Heat map representation of leading edge analysis for the three gene sets (right). Overlap between leading edge subsets is marked by color‐coded dots. (E): GO enrichment plot of GO for regulation of stem cell proliferation and heat map representation of gene expression.
