Figure 7.

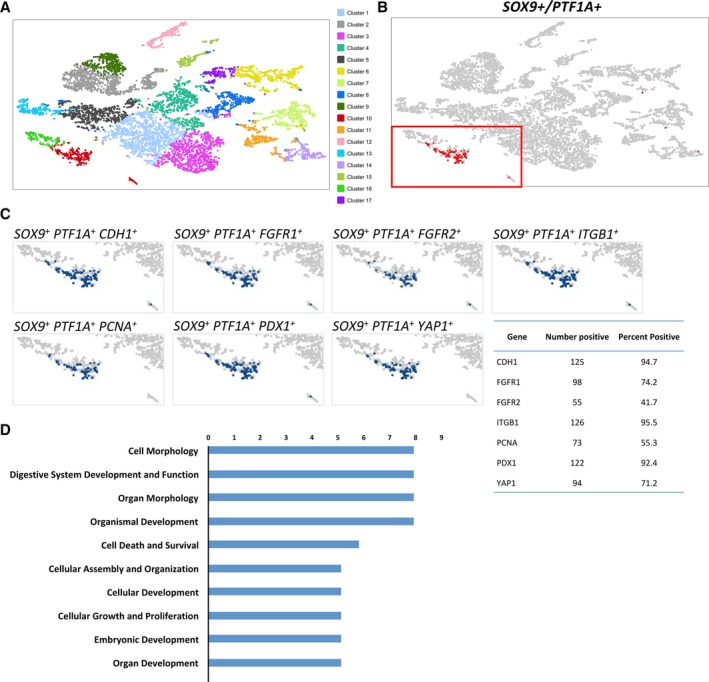
Single‐cell RNA‐seq of a 15.4WGA hFP. (A): tSNE plot of single‐cell RNA‐seq of ~8,000 cells dissociated from a 15.4 WGA hFP. Seventeen clusters were identified. (B): Identification of SOX9+/PTF1A+ cells within a single cluster (cluster #10, red). (C): Visualization of SOX9+/PTF1A+ cells (within cluster #10) and expression of different progenitor markers and their relative representation within the cluster. Genes listed: CDH1, CTNNB1, FGFR1, FGFR2, ITGB1, PCNA, PDX1, and YAP1. (D): IPA analysis of cluster 10 obtained from the tSNE analysis. Differentially expressed genes (p < .05, FDR p < .05) were used to identify the most significant biological functions for cluster #10 where SOX9+/PTF1A+ cells were identified. The top 10 most relevant functions are listed here.
