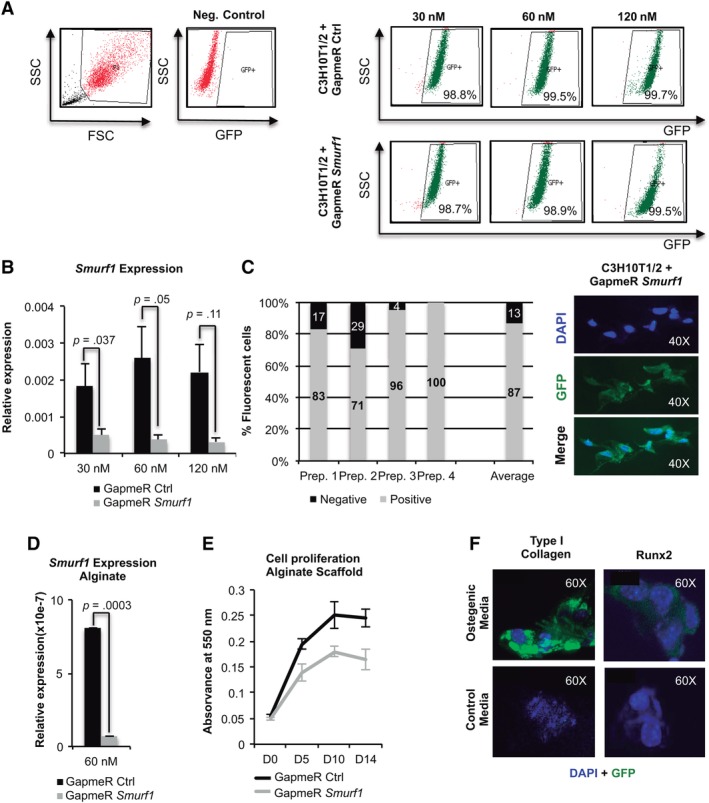
Figure 1.

Setup of the locked nucleic acid antisense oligonucleotide (LNA‐ASO) alginate scaffold system. (A): Flow cytometry profile of C3H10T1/2 mesenchymal stem cells transduced with the control and Smurf1 LNA‐ASOs. These molecules are designed to carry a fluorophore and therefore expressing GFP. Numbers show the percentage of cells positive for GFP 48 hours after transduction in each case. (B): PCR performed with a pair of oligonucleotides that specifically detects the Smurf1 transcript on C3H10T1/2 cells transduced with the different GapmeRs. Values reflect averages of triplicate samples. The transcript levels were normalized to GAPDH and RLP13A1 for all reactions. Bars represent standard error of the mean values. (C): Graph representing the percentages of fluorescent cells attached to the alginate scaffold, as showed in the picture, per 100 cells counted. The average bar represents the average values from four independent areas. (D): Specific PCR for the detection of the Smurf1 transcript indicates a high degree of silencing of this gene in the cells, transfected with the Smurf1 GapmeR, and growing onto the scaffold. (E): Growth curves of C3H10T1/2 cultures transduced with the different GapmeRs at different days of culture. The graph represents the absorbance of the cultures once treated with MTT. Values correspond to three independent cultures in each case. (F): Inmunofluorescence study of Runx2 and collagen I expression in cells undergoing differentiation in the microenvironment of the alginate scaffold. Runx2 analysis was performed at 4 days after the initiation of the induction. Col1A1 analysis was performed at day 10 of osteogenic differentiation. Cells seeded to the scaffolds growing in normal media were used as control.
