
Figure 4.
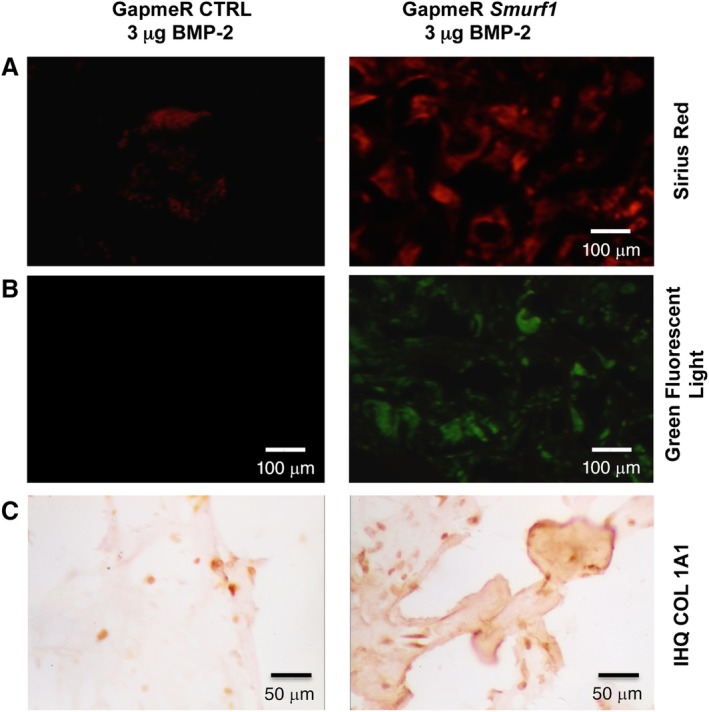
Sirius red‐polarization/fluorescence detection of collagen fibers and immunohistochemical analysis of subdermical implants in rats. Pictures show analysis of sections obtained from decalcified implants (n = 4). (A): Polarization microscopy of Sirius red stained collagen fibers, showing birefringence of collagen enriched areas. (B): Slides observed under green fluorescent showing the typical autofluorescence of collagen fibers. (C): Immunohistochemistry analysis of the correspondent sections using a Col1a1 antibody where arrows indicate regions rich in COL1a1. Magnification: ×4.