Figure 5.

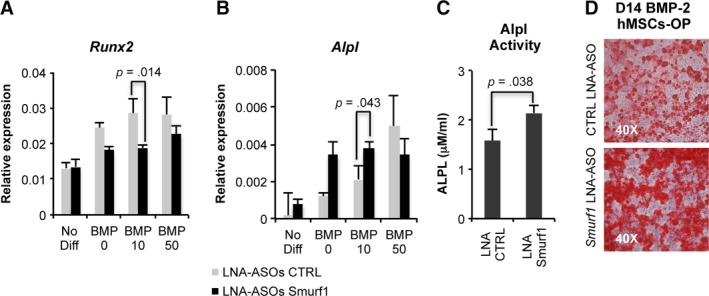
Differentiation capacity of hMSC from osteoporotic patients. (A, B): Quantitative PCRs showing the relative expression levels of different osteogenic markers (Runx2 and Alpl) in hMSCs from osteoporotic patients (MSC‐OP) transfected with a control GapmeR and a GapmeR for the silencing of Smurf1. Graphs show expression of the analyzed markers in the presence of different doses of BMP‐2. Values reflect averages of triplicate samples. (B) Graph showing a significant increase in the Alpl activity in MSC‐OP treated with the Smurf1 GapmeR and differentiated for 8 days in the presence of 10 ng/ml BMP‐2. (C): Osteogenic differentiation of the same hMSCs‐OP transfected with the Smurf1 GapmeR and differentiated in the presence of 10 ng/ml BMP‐2 as revealed by Alizarin red staining bars represent standard error of the mean values. p‐Values are indicated.
